
- What the Nifty 50 News Screener is
- Why screen on news instead of price
- How a single scan works
- The ten dashboard sections, one by one
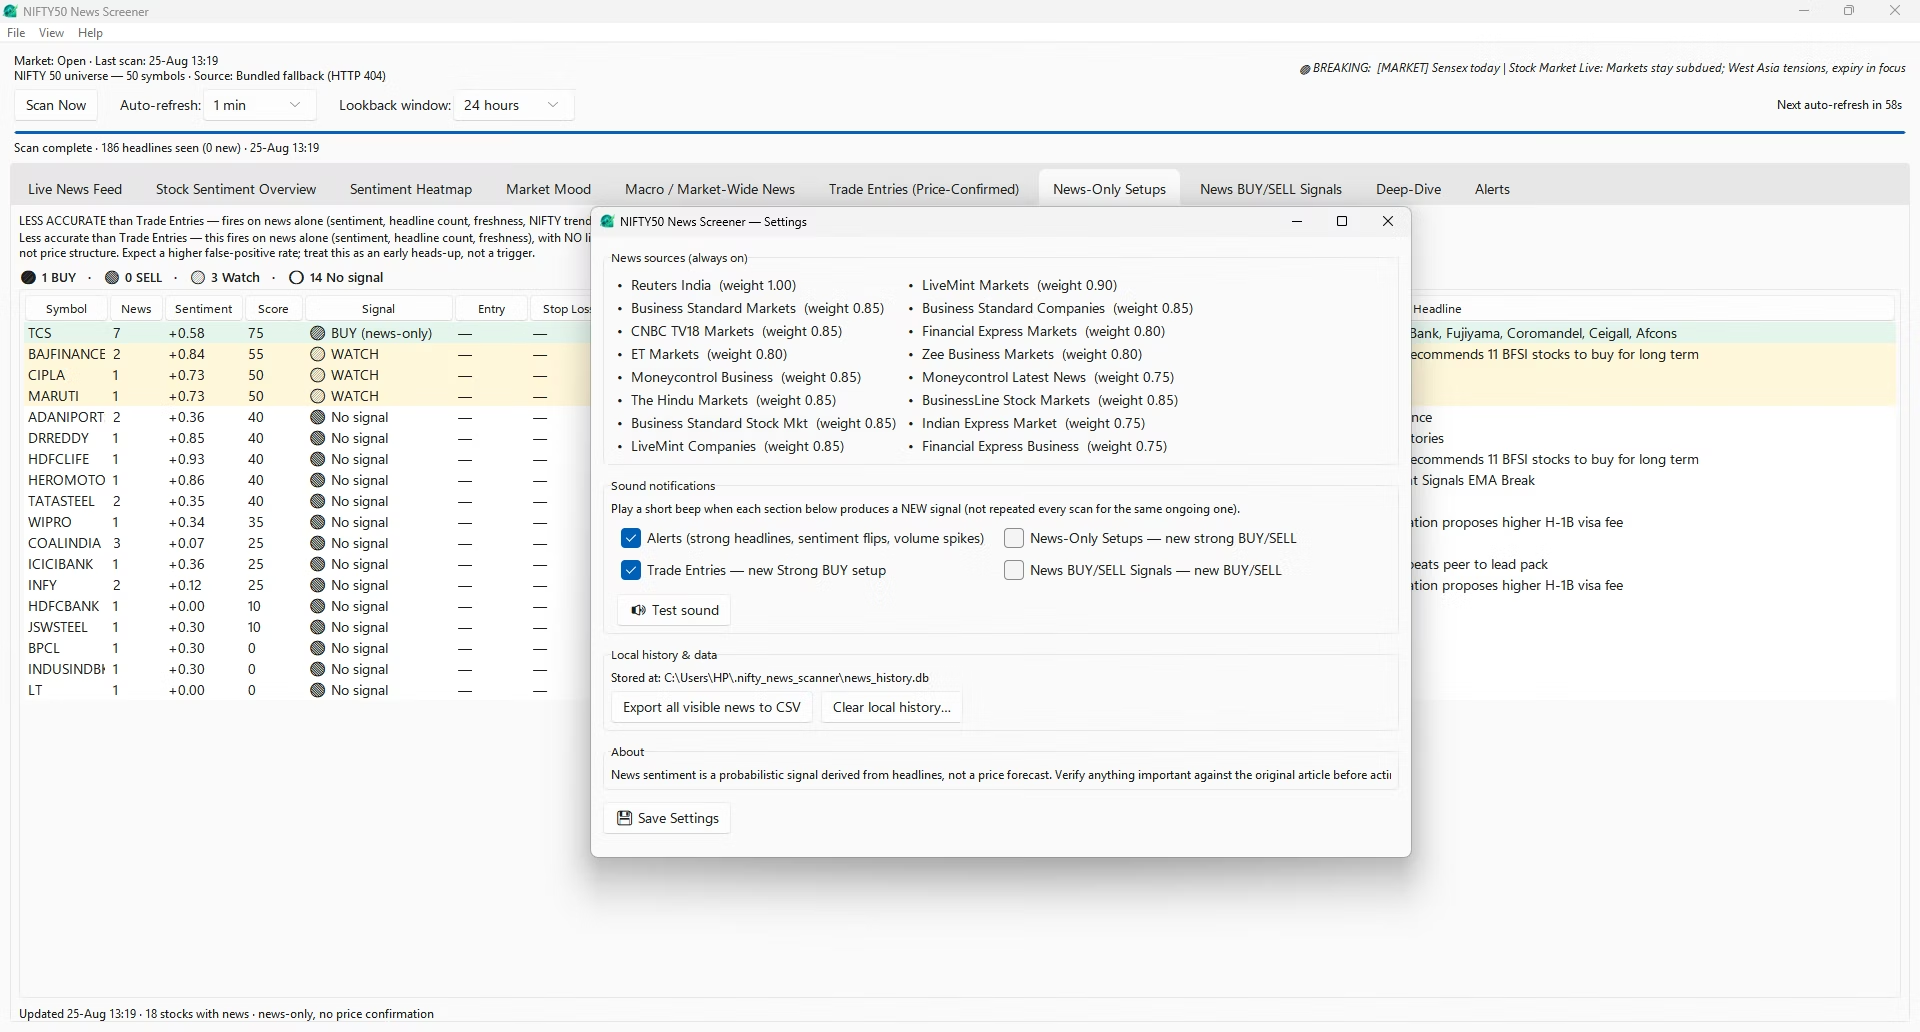
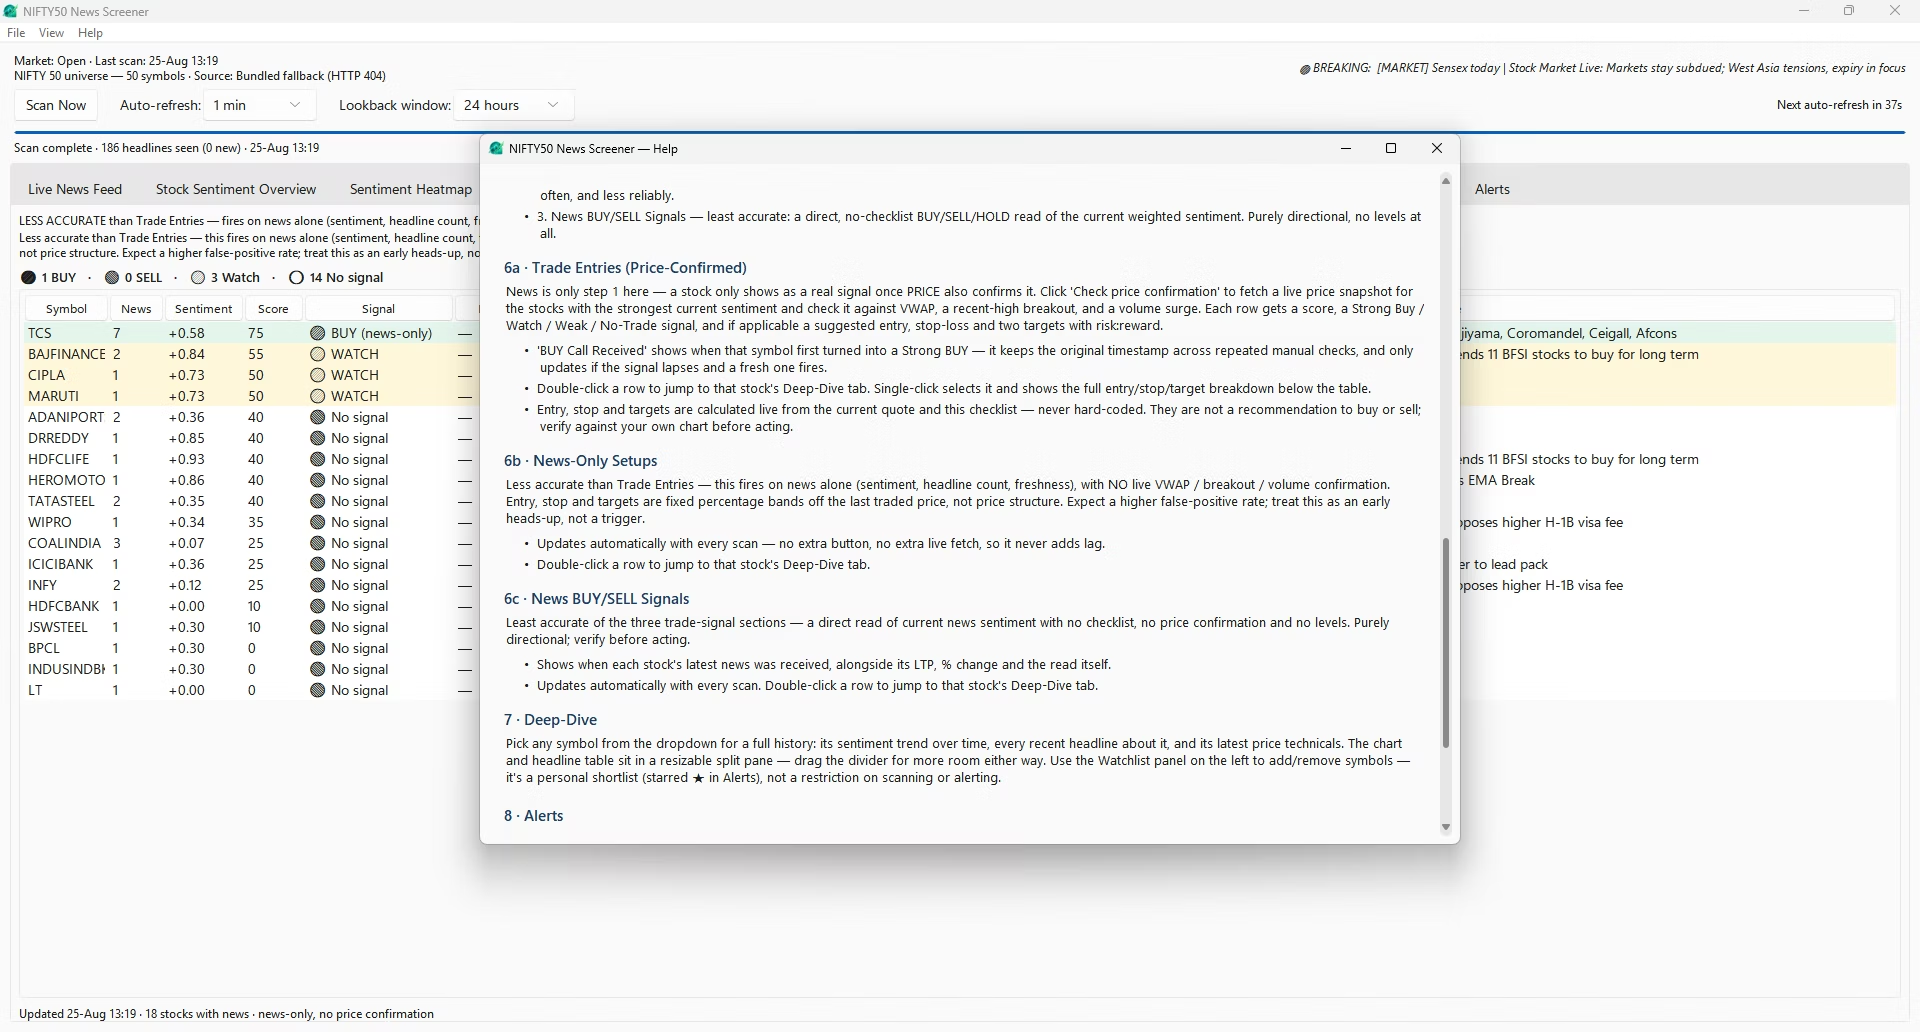
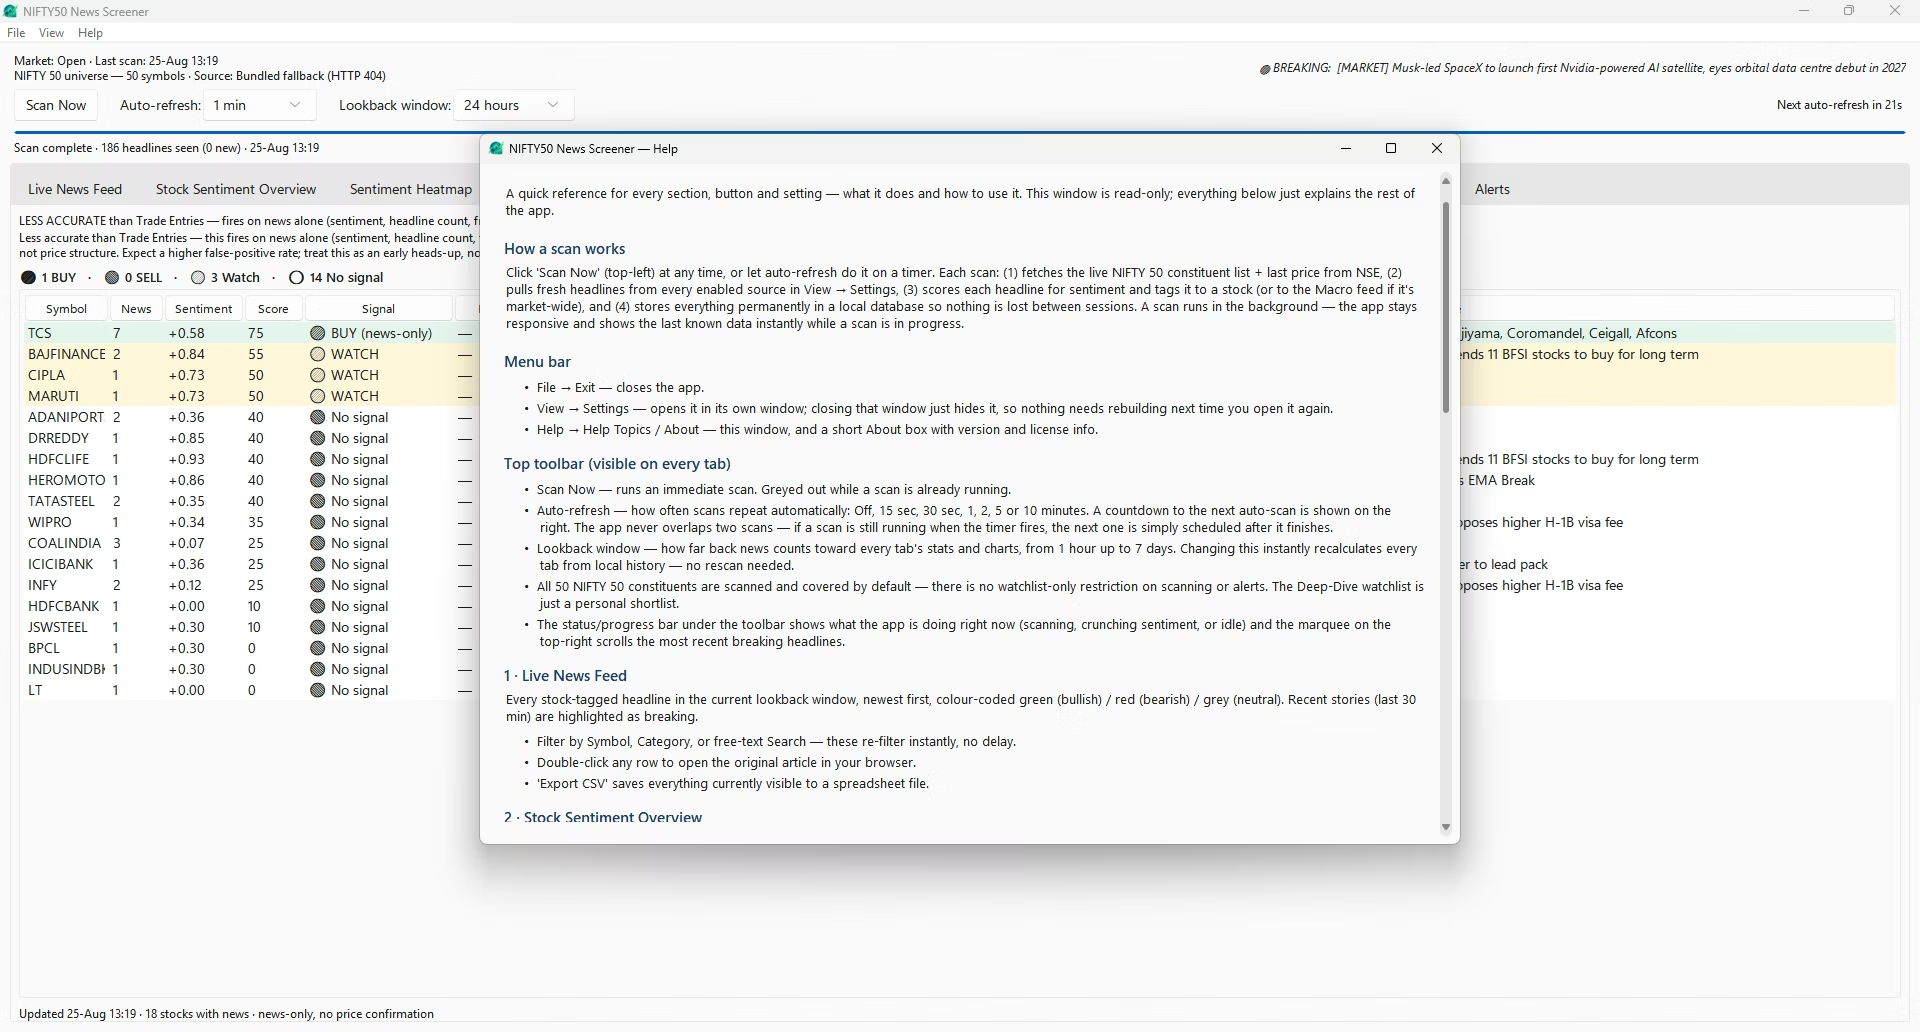
- Settings and Help windows
- Inside the sentiment engine
- The three signal layers compared
- The sixteen news sources
- How headlines get categorised
- Coverage and sector map
- The alert engine
- Local history, privacy and data
- Who this is built for
- Screenshots
- System requirements
- Install and activation
- Glossary of terms
- Frequently asked questions
- Leave a review
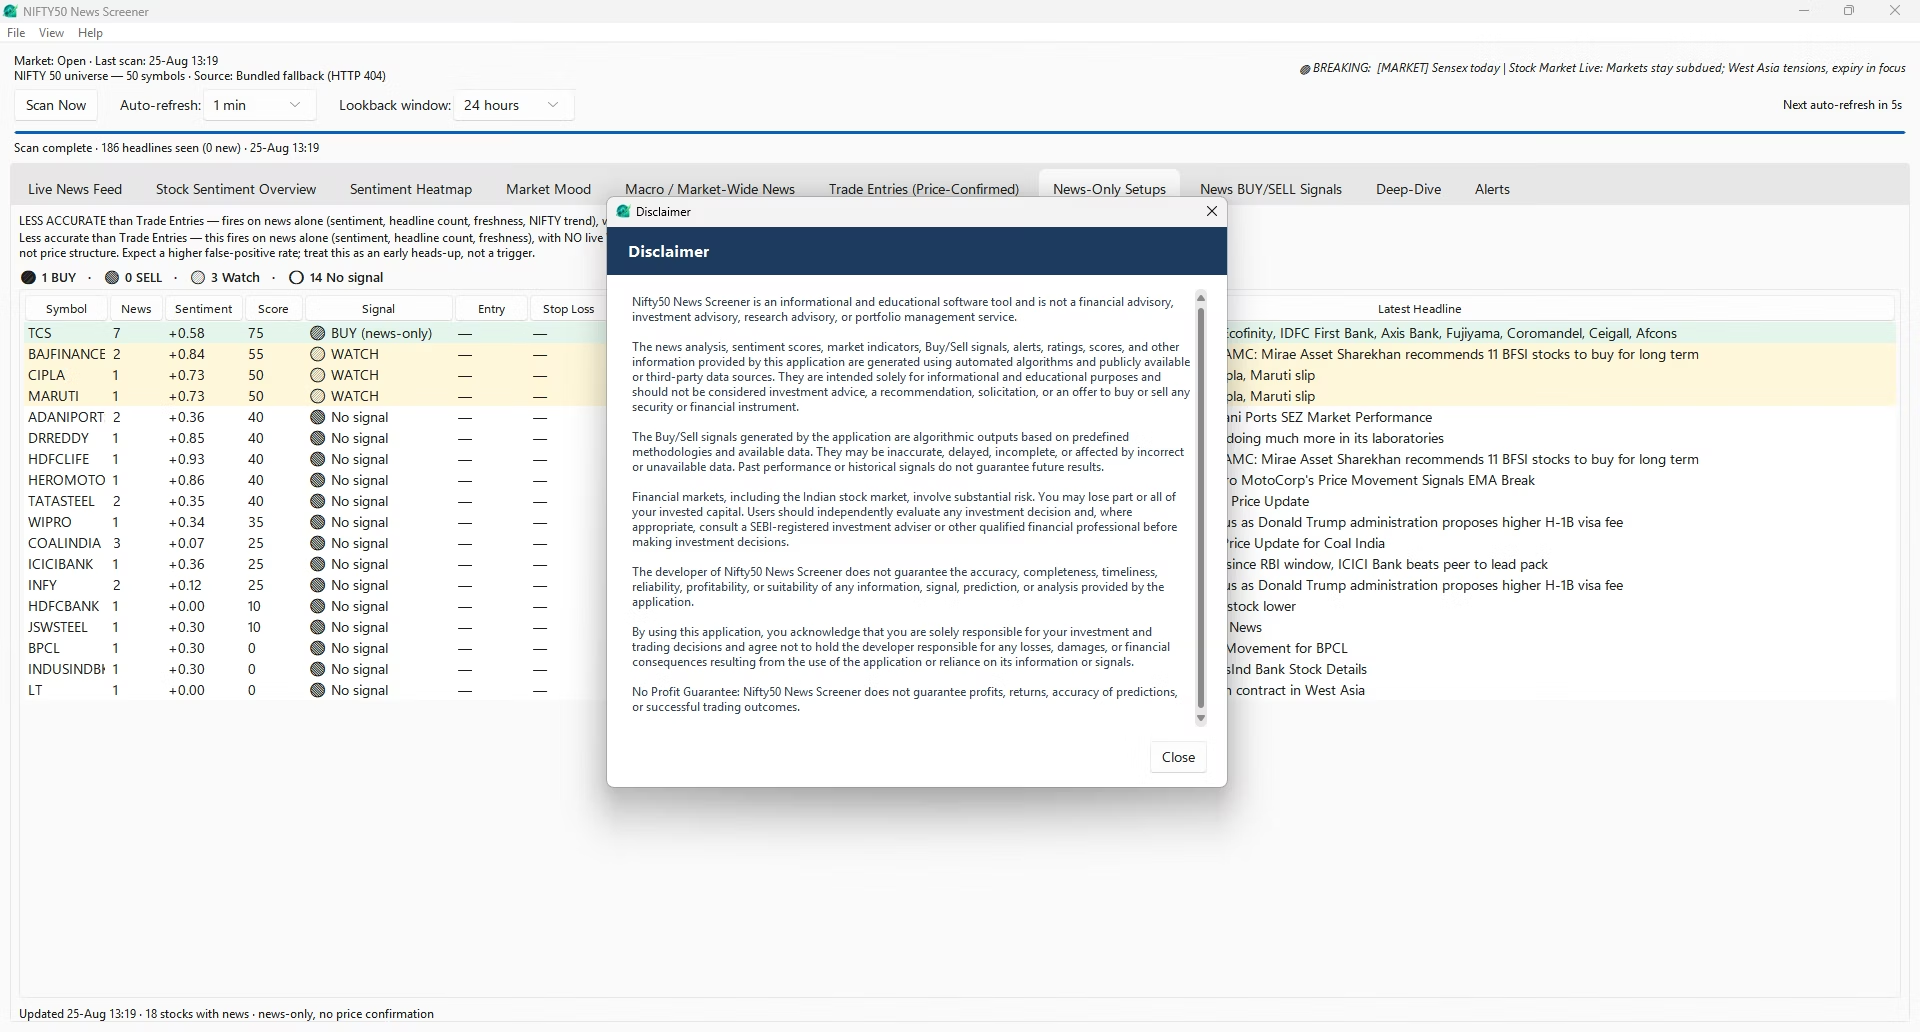
- Risk disclaimer
What the Nifty 50 News Screener actually is
A single-purpose Windows desktop application that turns the firehose of Indian market news into a ranked, colour-coded, per-stock view of the index.
Most screeners in the Indian market work on numbers. You give them a filter such as RSI below thirty, price above the two-hundred-day moving average, or delivery volume above a certain multiple, and they hand you a list. That is useful, and there is no shortage of tools that do it. What almost none of them do is read. Price data tells you what already happened; the story that caused it is sitting in a headline that broke eleven minutes earlier on a feed you were not watching.
This application is built around that gap. It is a Nifty 50 stock screener whose filter is language rather than arithmetic. Every sixty seconds, by default, it fetches the live constituent list from the exchange, pulls fresh Nifty 50 stock news from sixteen Indian financial RSS feeds, runs each headline through a sentiment model that has been extended with market vocabulary, works out which constituent the story belongs to, and files it permanently in a local database. Everything you see on screen — the heatmap, the leaderboards, the mood gauge, the Nifty 50 buy sell signals — is computed from that store.
It runs as NIFTY50 News Screener on your Windows desktop and needs no browser tab, no login session and no cloud account. The only network requests it makes are to the exchange for the constituent list and last-traded price, to the sixteen news feeds, and once to verify your licence key.
What it is not
It is worth being blunt about the boundaries, because a lot of software in this category is sold on claims it cannot support. This tool does not predict price. It does not quote an accuracy percentage, because sentiment is a noisy probabilistic input and any number attached to it would be marketing rather than measurement. It does not place orders, connect to a broker, or manage a portfolio. It carries no option chain, no futures data and no backtesting module. Earlier versions of the tool did include a seven-indicator technical engine, a BTST scan mode, an options risk helper and a position-size calculator; all of them were deliberately removed so the news and sentiment side could be developed properly rather than merely adequately.
The one-line version
It reads Nifty 50 news faster than you can, remembers every headline it has ever read, and shows you where the tone of coverage on a stock has changed — with three increasingly cautious layers of interpretation on top.
The five things it does that a browser tab cannot
- It never sleeps between refreshes. A one-minute auto-scan runs whether or not the window has focus, with a visible countdown to the next pass and a guarantee that two scans never overlap.
- It de-duplicates across outlets. When three publications carry the same story, you get one row with a corroboration badge instead of three rows of clutter.
- It remembers. Headlines, sentiment snapshots, price ticks and alerts are saved to a local news history on your own machine, so a trend line on day seven is drawn from seven days of accumulated data, not from the twenty headlines currently on screen.
- It weights by recency and by source. A story from an hour ago counts for more than one from yesterday, and a wire service counts for more than an aggregator's latest-news firehose.
- It tells you when something changed. Sentiment flips, unusually strong single headlines and news-volume spikes raise a desktop toast and an optional beep across all fifty stocks, not just a watchlist.
How a single scan works, start to finish
Press Scan Now, or let the timer do it. Four things happen in the background while the window stays fully usable.
Fetch the live universe
The app asks the exchange for the current Nifty 50 constituent list along with each stock's last traded price and percentage change. If that request fails it falls back to a locally cached list, and if no cache exists yet it uses a bundled fifty-symbol fallback so a scan is never blocked.
Pull the feeds in parallel
All sixteen sources are fetched at the same time rather than one after another, so a slow publisher delays only itself and never the whole pass. Each source carries a reliability weight between 0.75 and 1.00 that follows its headlines through every later calculation.
Score, tag and categorise
Every headline is scored for sentiment, matched against the fifty symbols and a brand-name map, sorted into one of eight categories, checked against the macro keyword list, and hashed so the same story from a second outlet joins the existing cluster instead of creating a new row.
Store, recompute, alert
Results are written to the local database, every tab is recomputed from the full lookback window, the alert engine compares the new state against the previous scan, and any toast or beep fires. The status bar and progress bar narrate the whole sequence.
The controls that sit above every tab
| Control | What it does | Detail worth knowing |
|---|---|---|
| Scan Now | Runs an immediate scan of all sixteen feeds. | Greys out while a scan is already in flight, so you cannot stack requests by clicking twice. |
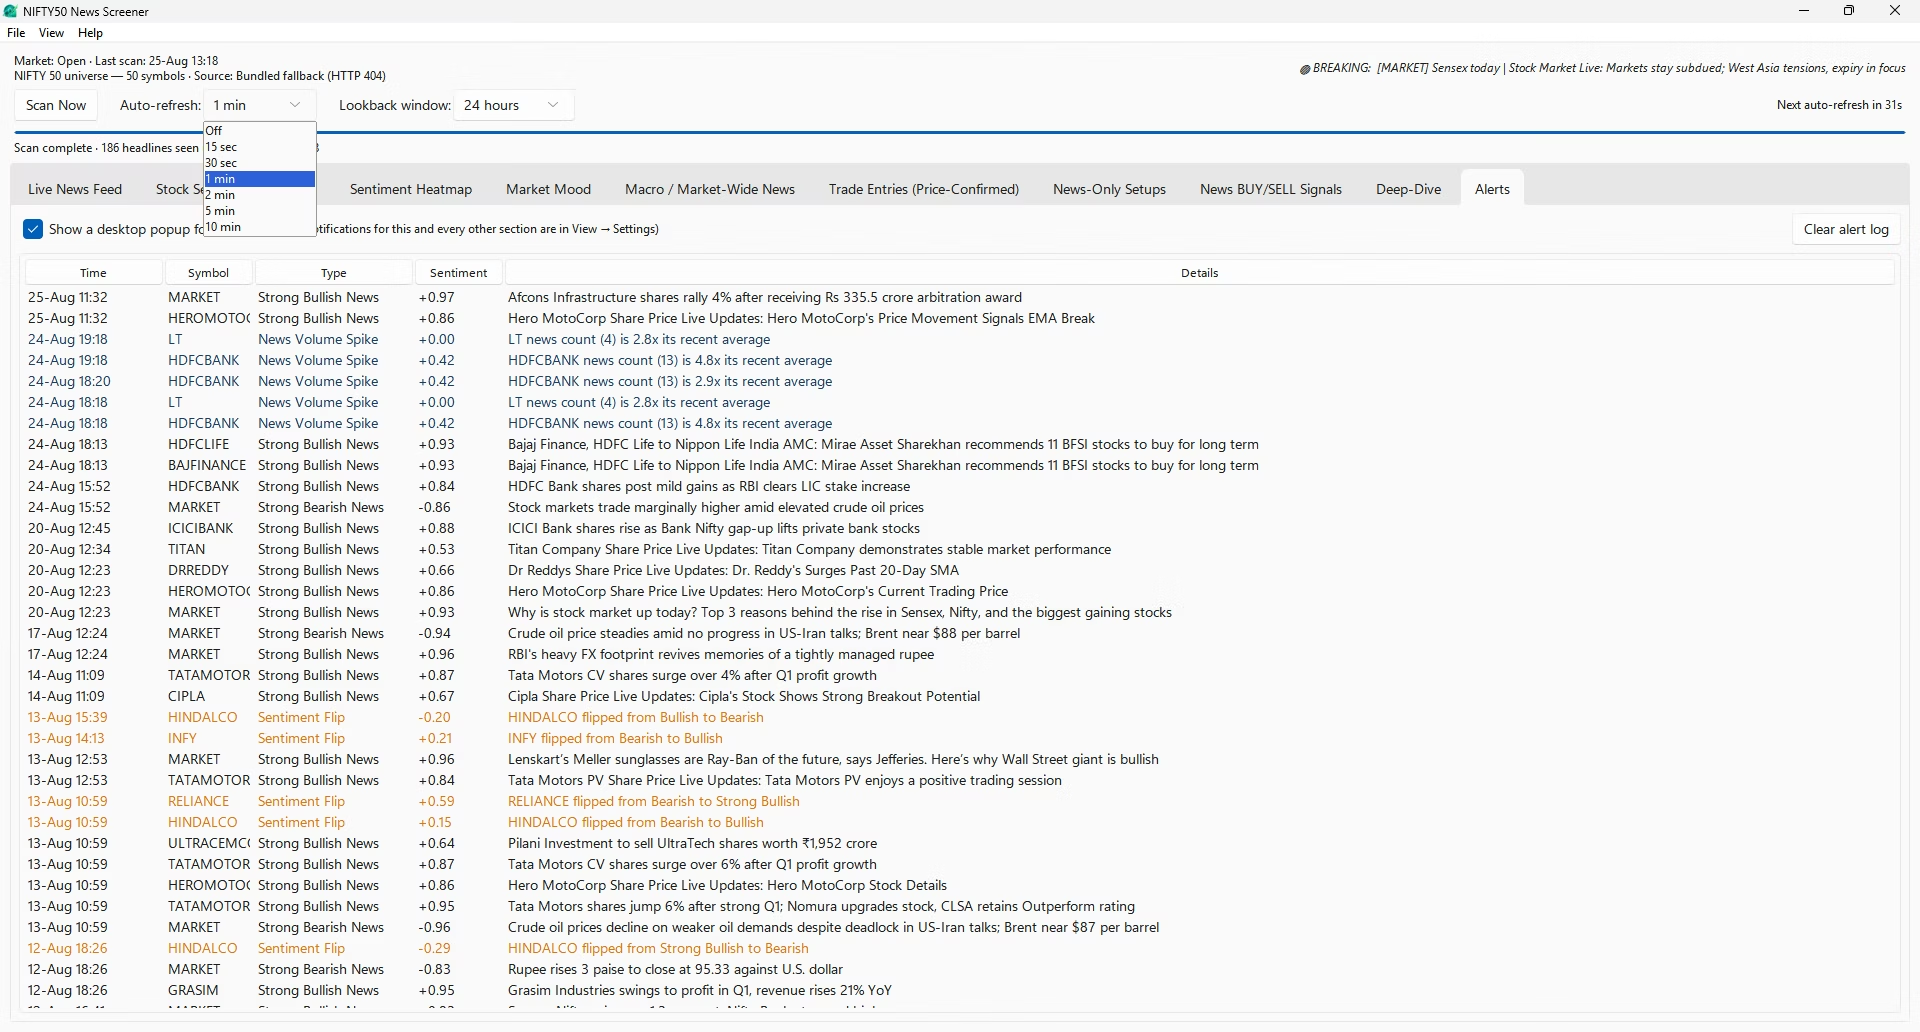
| Auto-refresh | Repeats the scan on a timer: off, 15 seconds, 30 seconds, 1, 2, 5 or 10 minutes. | Two scans never overlap. If the timer fires while a scan is running, the next one is queued for after it finishes. |
| Countdown | Shows seconds remaining until the next automatic scan. | Sits on the right of the toolbar so you always know how fresh the screen is. |
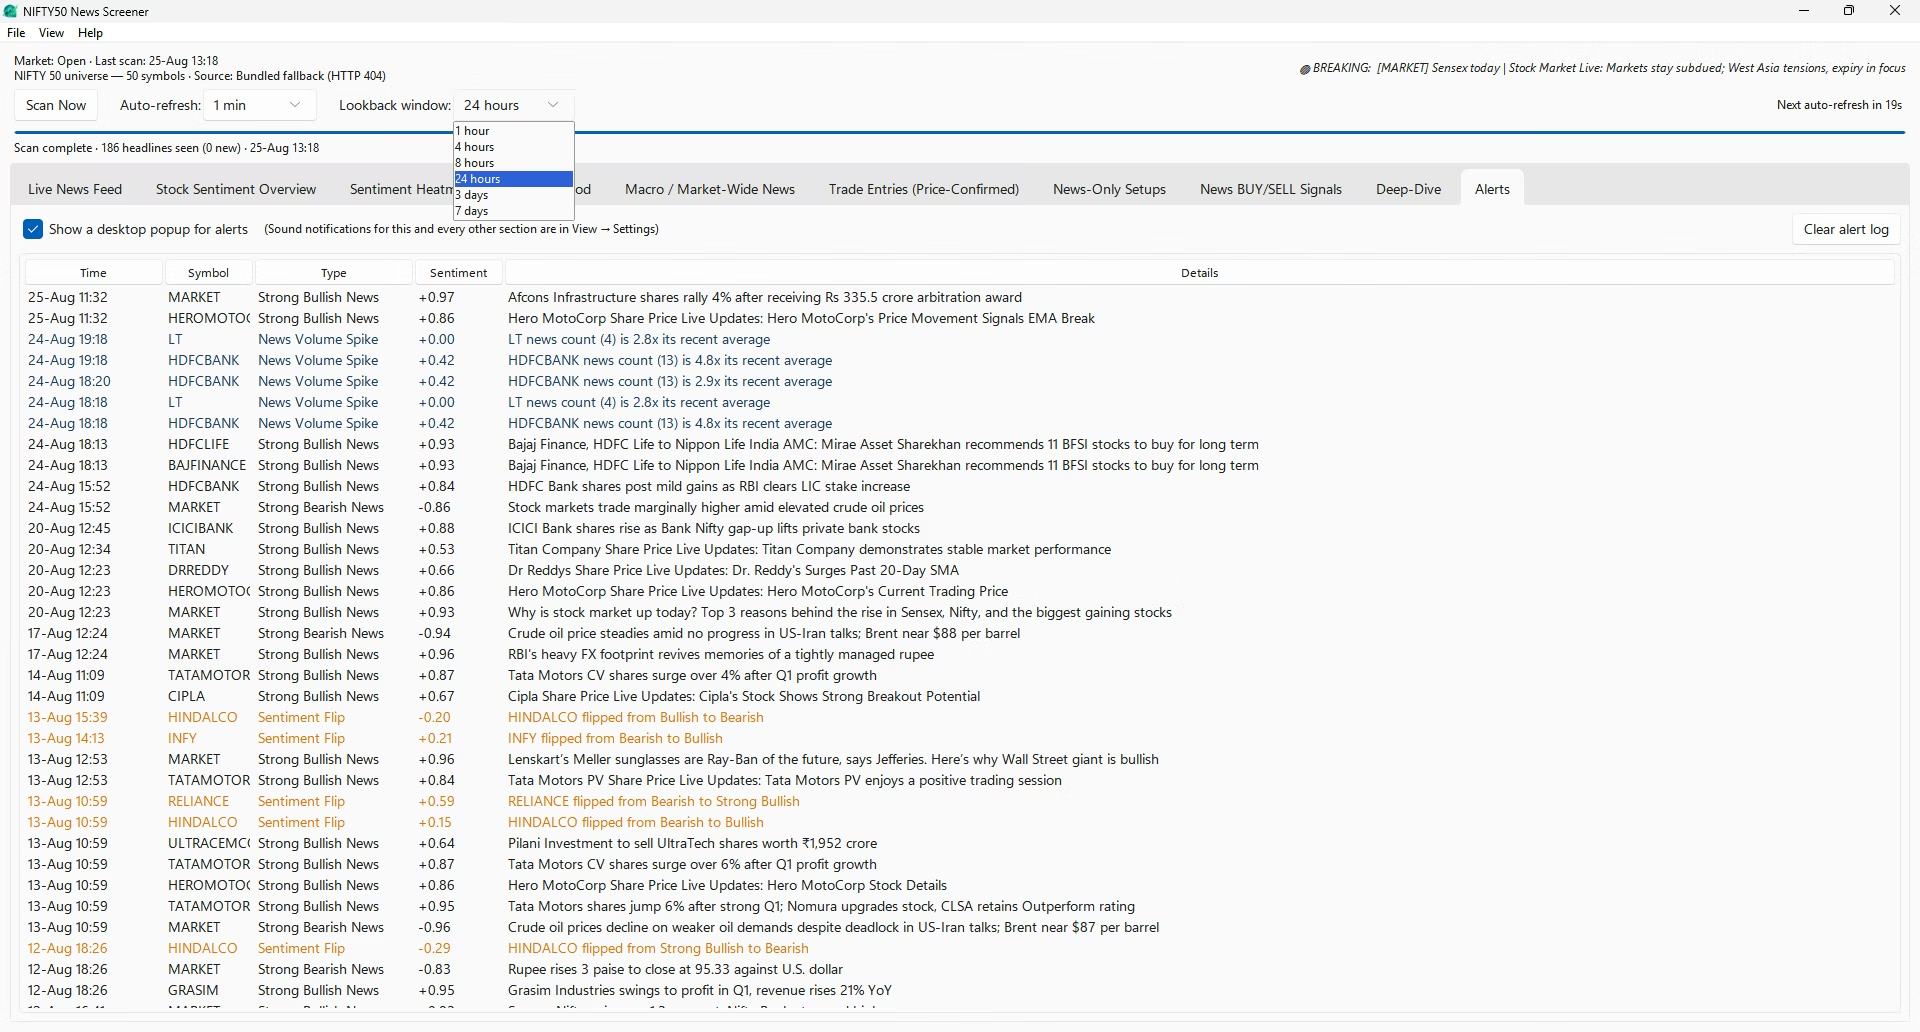
| Lookback window | How far back Nifty 50 news counts toward every statistic and chart — from one hour to seven days. | Changing it recalculates every tab instantly from local history. No rescan, no network call. |
| Status and progress bar | Narrates the current activity: fetching, crunching sentiment, or idle. | Useful for confirming that a slow feed, not the app, is the reason a pass is taking longer. |
| Breaking marquee | Scrolls the most recent breaking headlines across the top-right of the window. | Lets you keep the app on a second monitor and catch a major story without reading a table. |
Nothing blocks the interface
Scanning, sentiment scoring and screen updates all happen in the background. The window stays responsive throughout and keeps showing the last known state, so you are never staring at a frozen table while sixteen publishers are being queried.
The ten dashboard sections, explained one by one
The main window is a notebook of ten tabs, arranged roughly in the order you would use them: raw news first, aggregation second, interpretation third, and the per-stock detail view last. Almost every symbol on every tab is double-clickable and jumps straight to that stock's Deep-Dive.
-
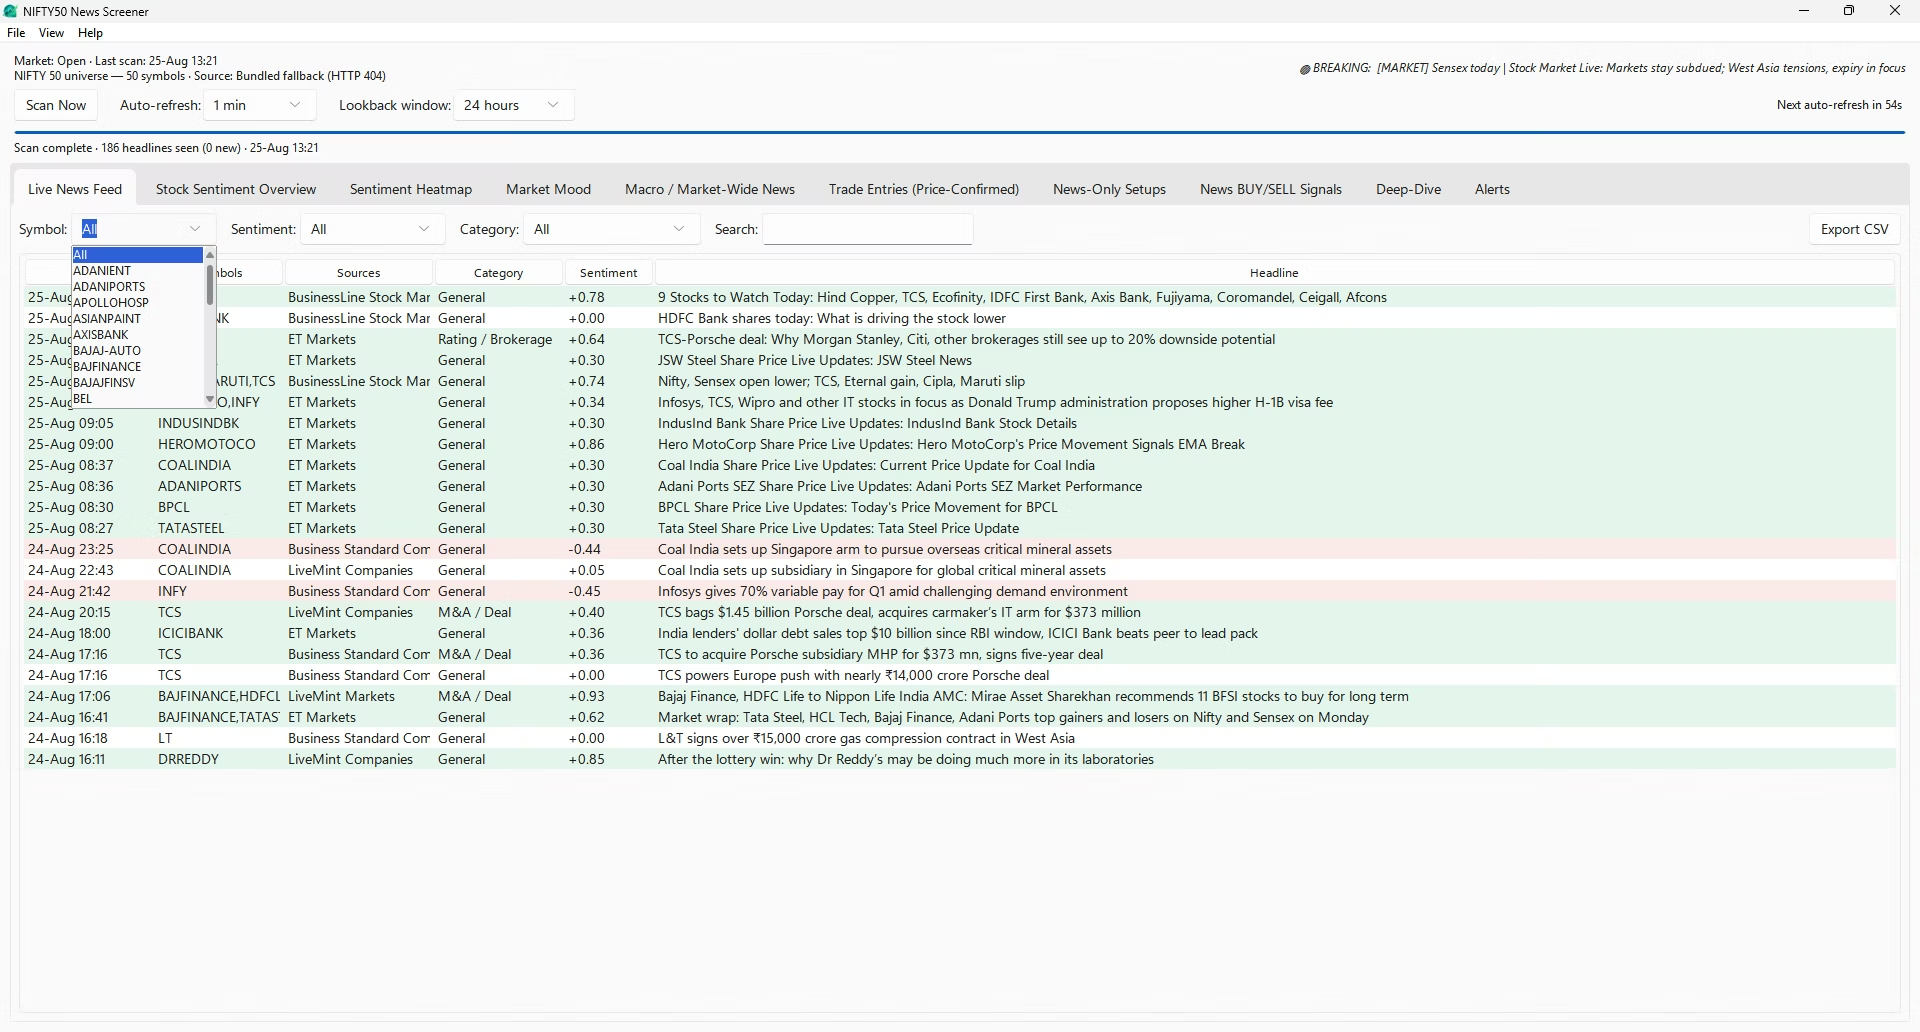
Live News Feed
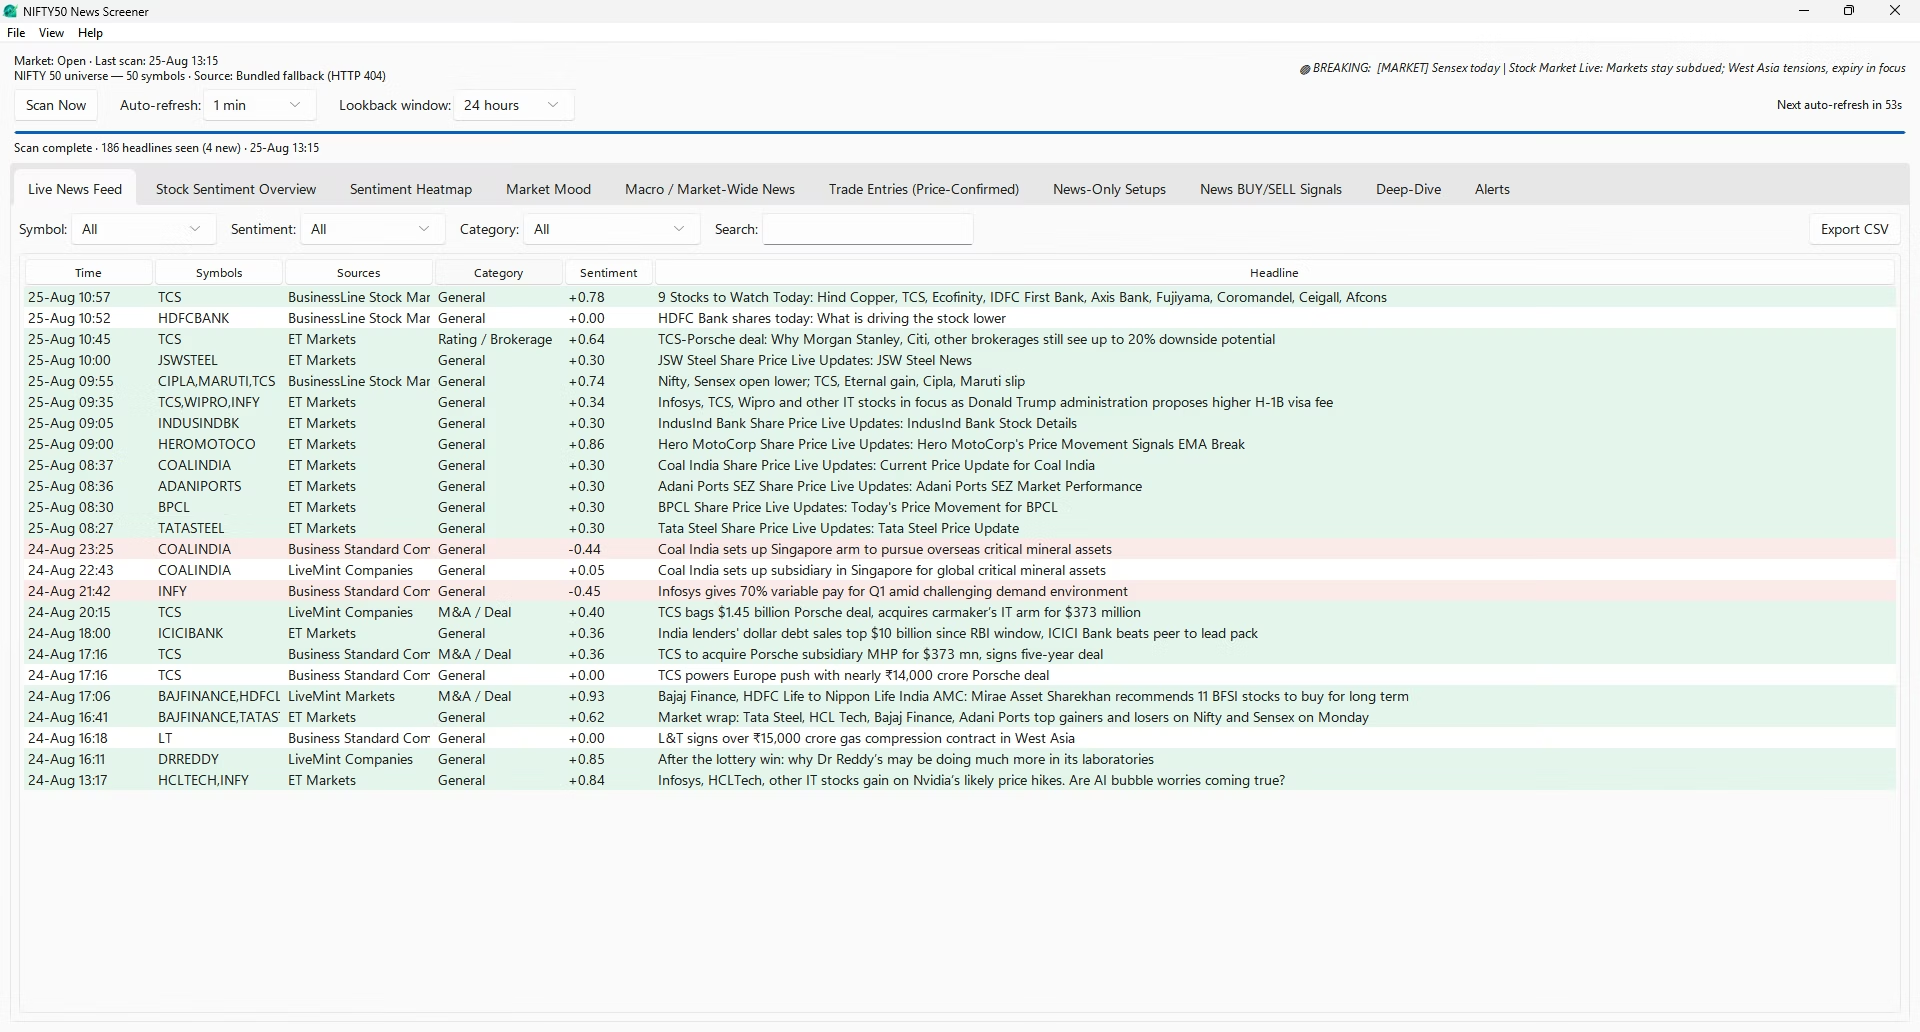
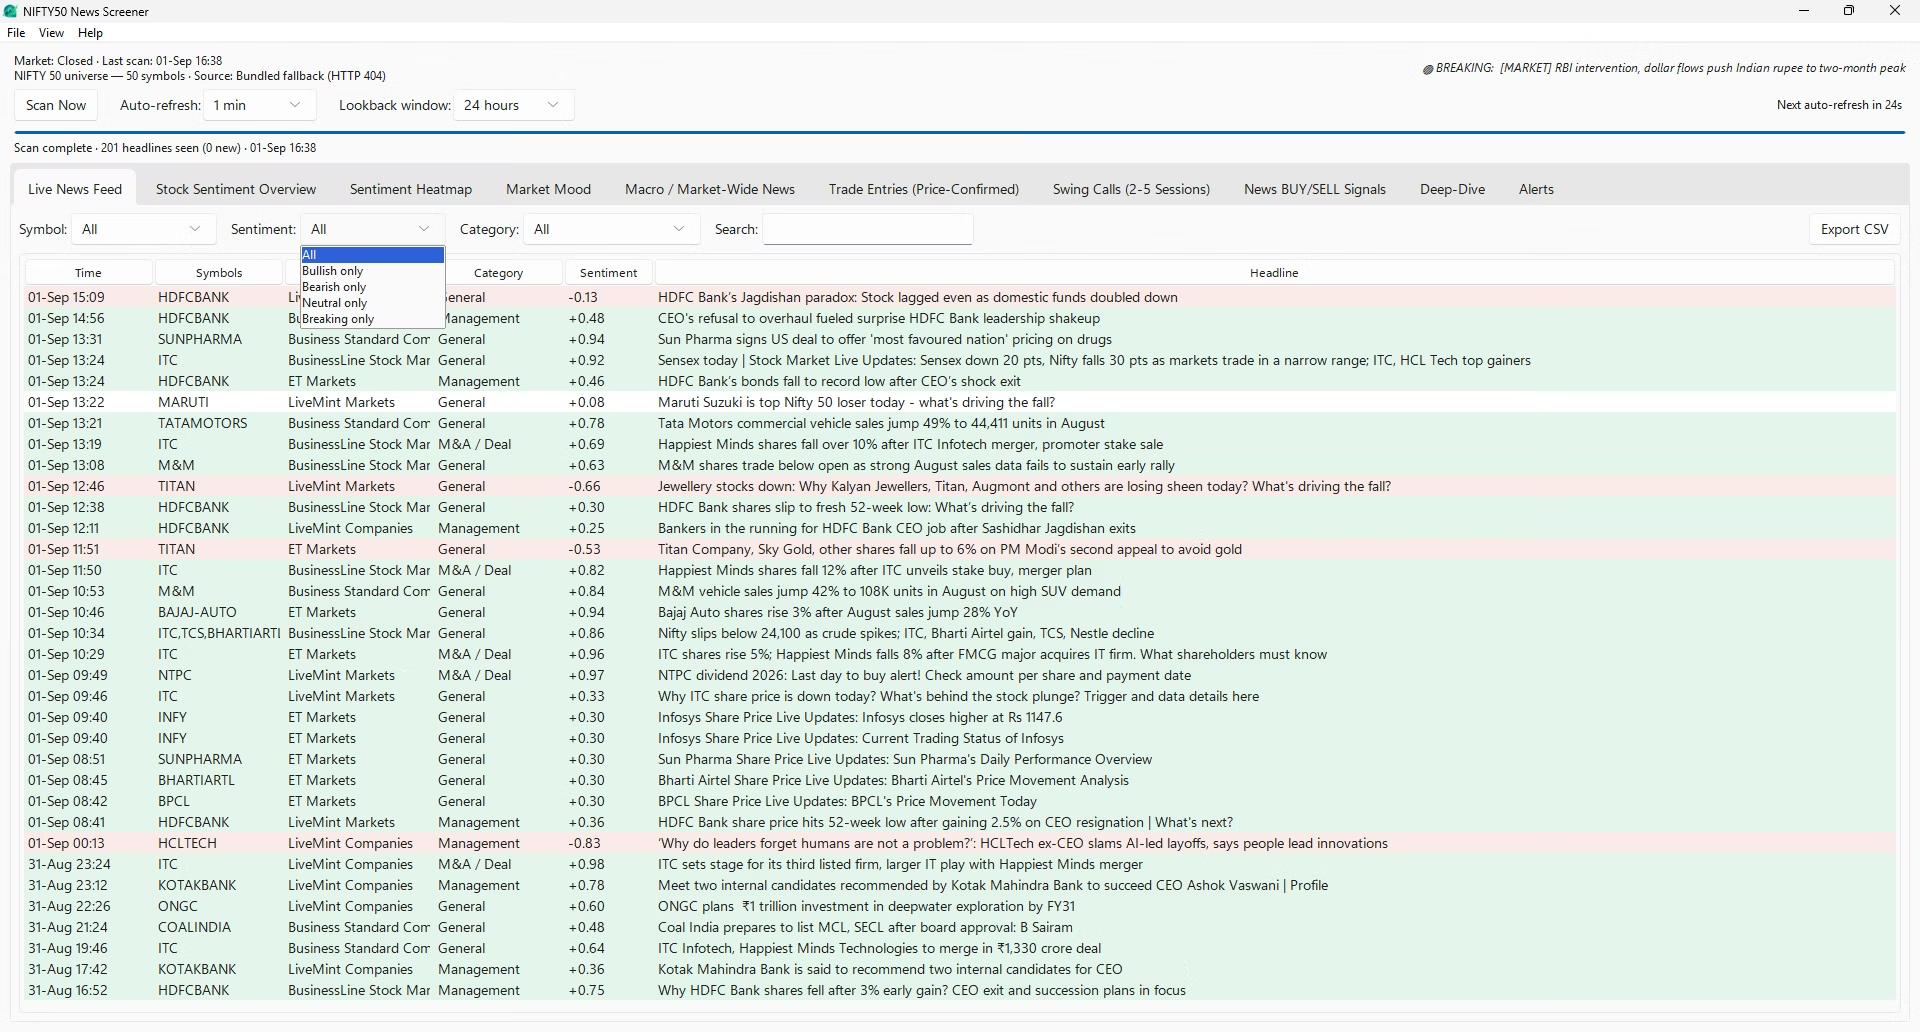
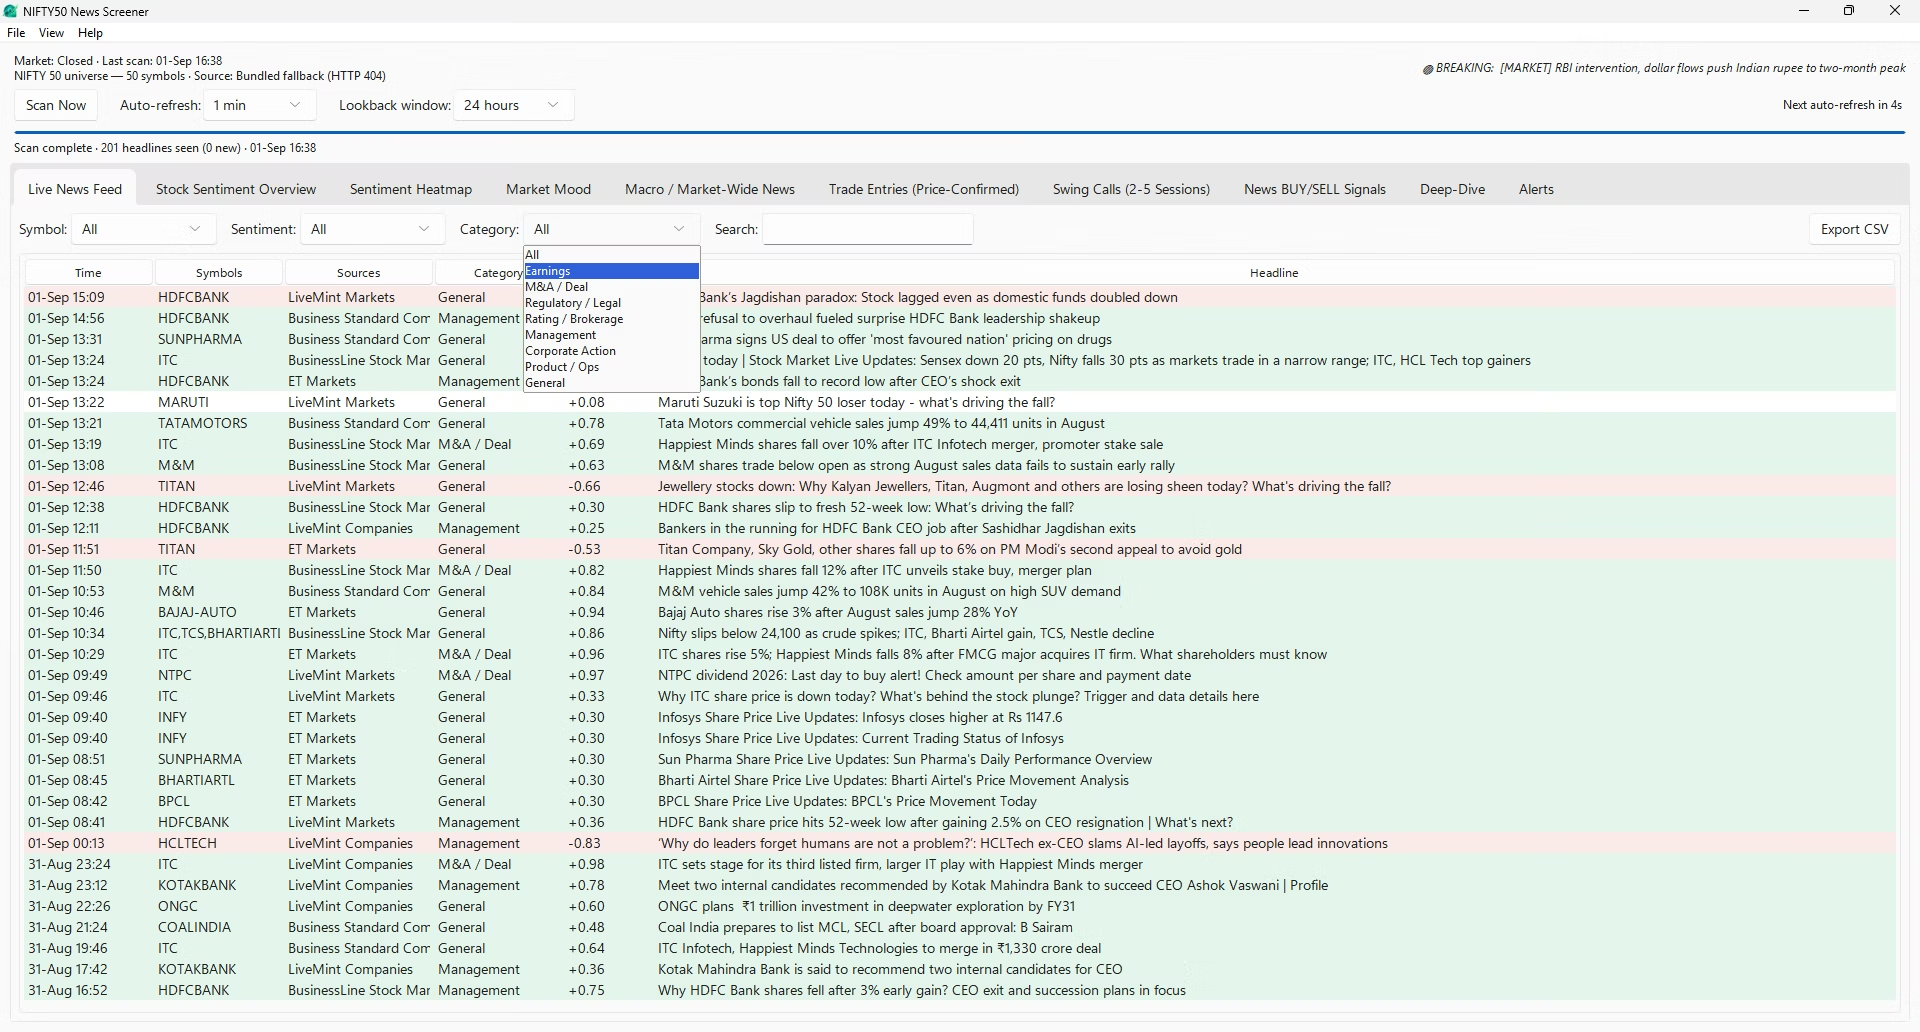
This is the tab you will leave open. It lists every stock-tagged headline inside your current lookback window, newest first, with six columns: time, symbols, sources, category, sentiment and the headline itself.
Rows are colour-coded on sentiment — green for bullish, red for bearish, grey for neutral — so the tone of the last hour of Nifty 50 news is legible from across the room without reading a word. Anything published in the last thirty minutes is additionally highlighted as breaking, in the same amber the marquee uses.
The sources column is where the de-duplication work becomes visible. If Business Standard, LiveMint and CNBC TV18 all carry the same acquisition story, you do not get three rows. You get one row with a corroboration count against it, which tells you at a glance that the market is looking at a real story rather than a single desk's speculation.
What you can do here
- Filter by symbol to isolate a single constituent's stream, which is the fastest way to answer "why is this stock moving".
- Filter by category to see only earnings stories, only regulatory stories, only brokerage actions, and so on.
- Free-text search across headlines for a word, a person or a subsidiary name. All three filters apply instantly against data already in memory, with no rescan and no delay.
- Double-click any row to open the original article in your default browser. The screener never asks you to trust its score without letting you check the source.
- Export CSV writes everything currently visible — filters applied — to a spreadsheet file, which is how most people move a day's Nifty 50 stock news into their own journal or model.
-
Stock Sentiment Overview
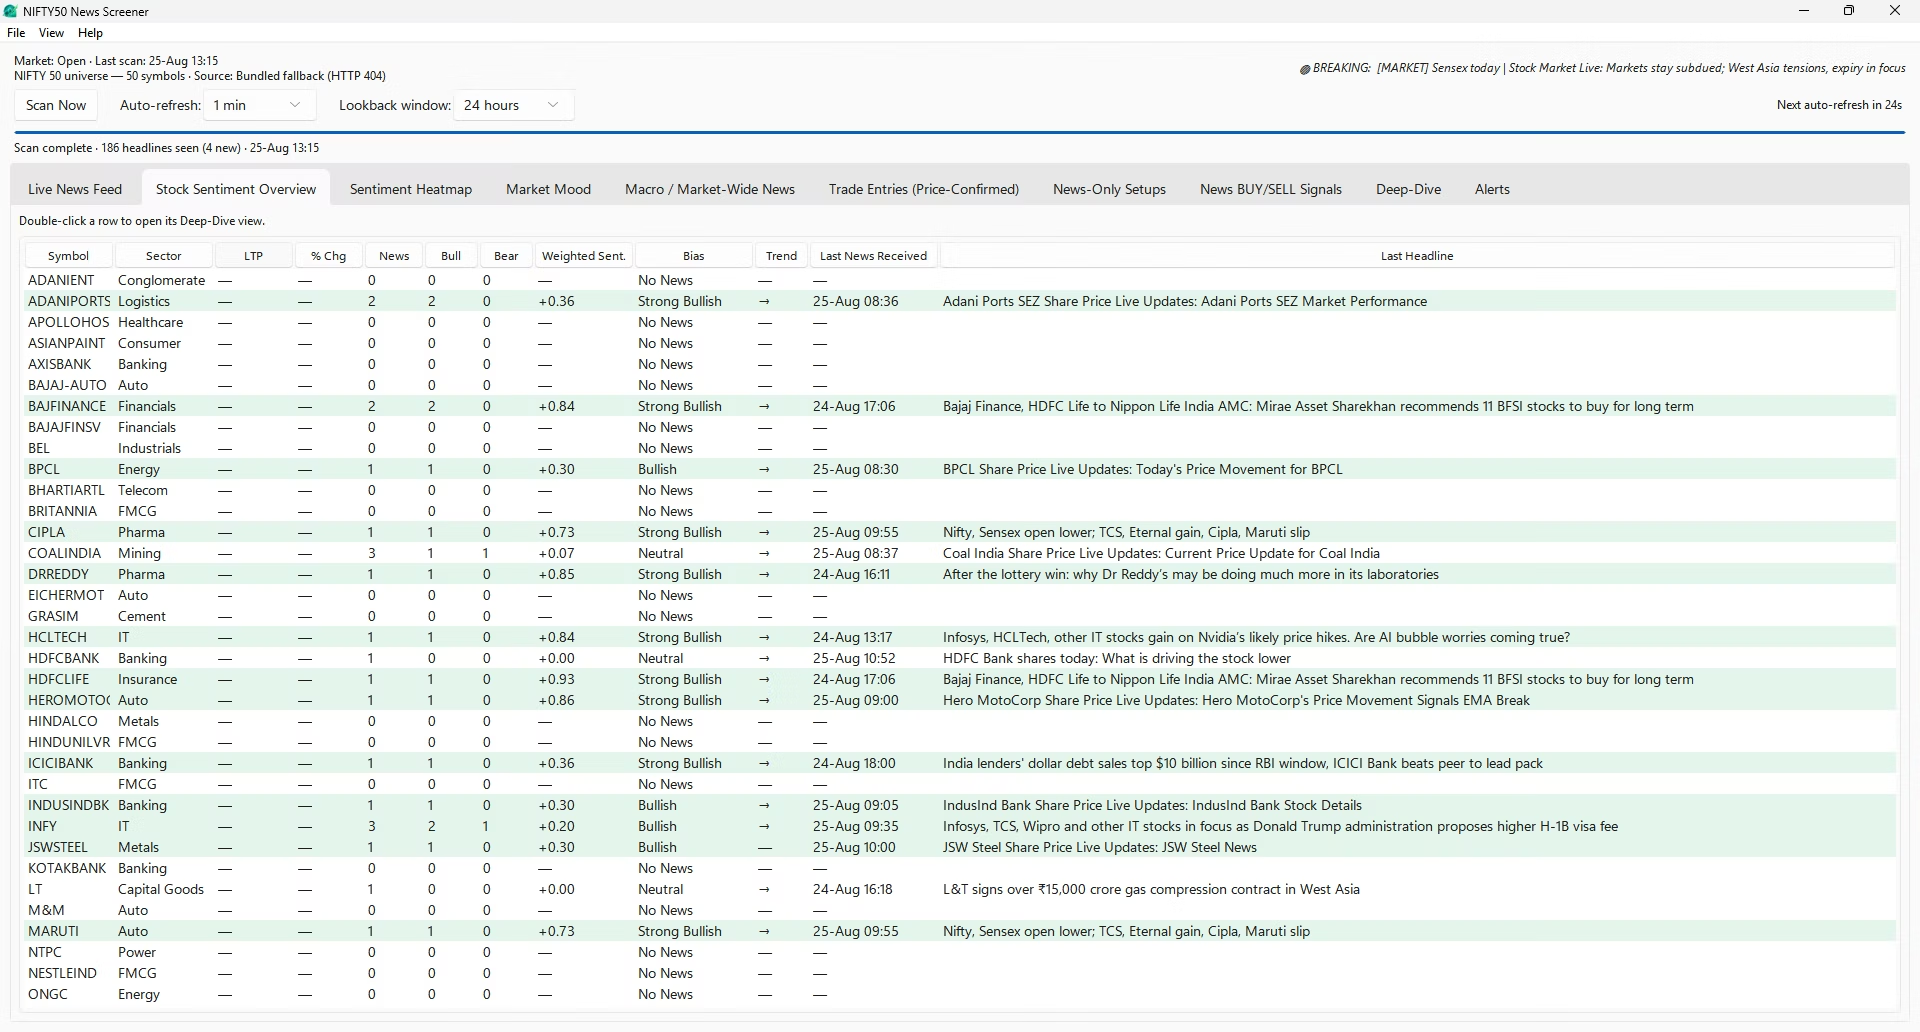
Where the feed is one row per headline, this is one row per stock: all fifty constituents, always, with twelve columns of state. Symbol, sector, last traded price, percentage change, total news count, bullish count, bearish count, weighted sentiment, a bias label, a trend arrow, the timestamp of the latest headline, and that headline's text.
The bias label is a plain-language band on the weighted sentiment number. At or above +0.35 a stock reads Strong Bullish; from +0.12 to +0.35, Bullish; between −0.12 and +0.12, Neutral; below −0.12, Bearish; at or below −0.35, Strong Bearish. With no qualifying stories in the window it simply says No News, which is information in itself — a Nifty 50 stock screener that leaves gaps blank is more honest than one that pretends every row has a signal.
The trend arrow compares the current weighted sentiment against the previous scan and shows an up, down or flat marker. This is the column that catches turns. A stock can be sitting at Bullish all morning and still be worth attention if it has spent three consecutive scans drifting toward the middle.
Every column header sorts. Sort by weighted sentiment to rank the index by tone, by news count to find whatever the market is arguing about today, or by percentage change to see where price and Nifty 50 news disagree — a stock that is red on the day with three strongly bullish headlines is exactly the sort of divergence worth a second look. Double-clicking any row jumps to that stock's Deep-Dive.
-
Sentiment Heatmap
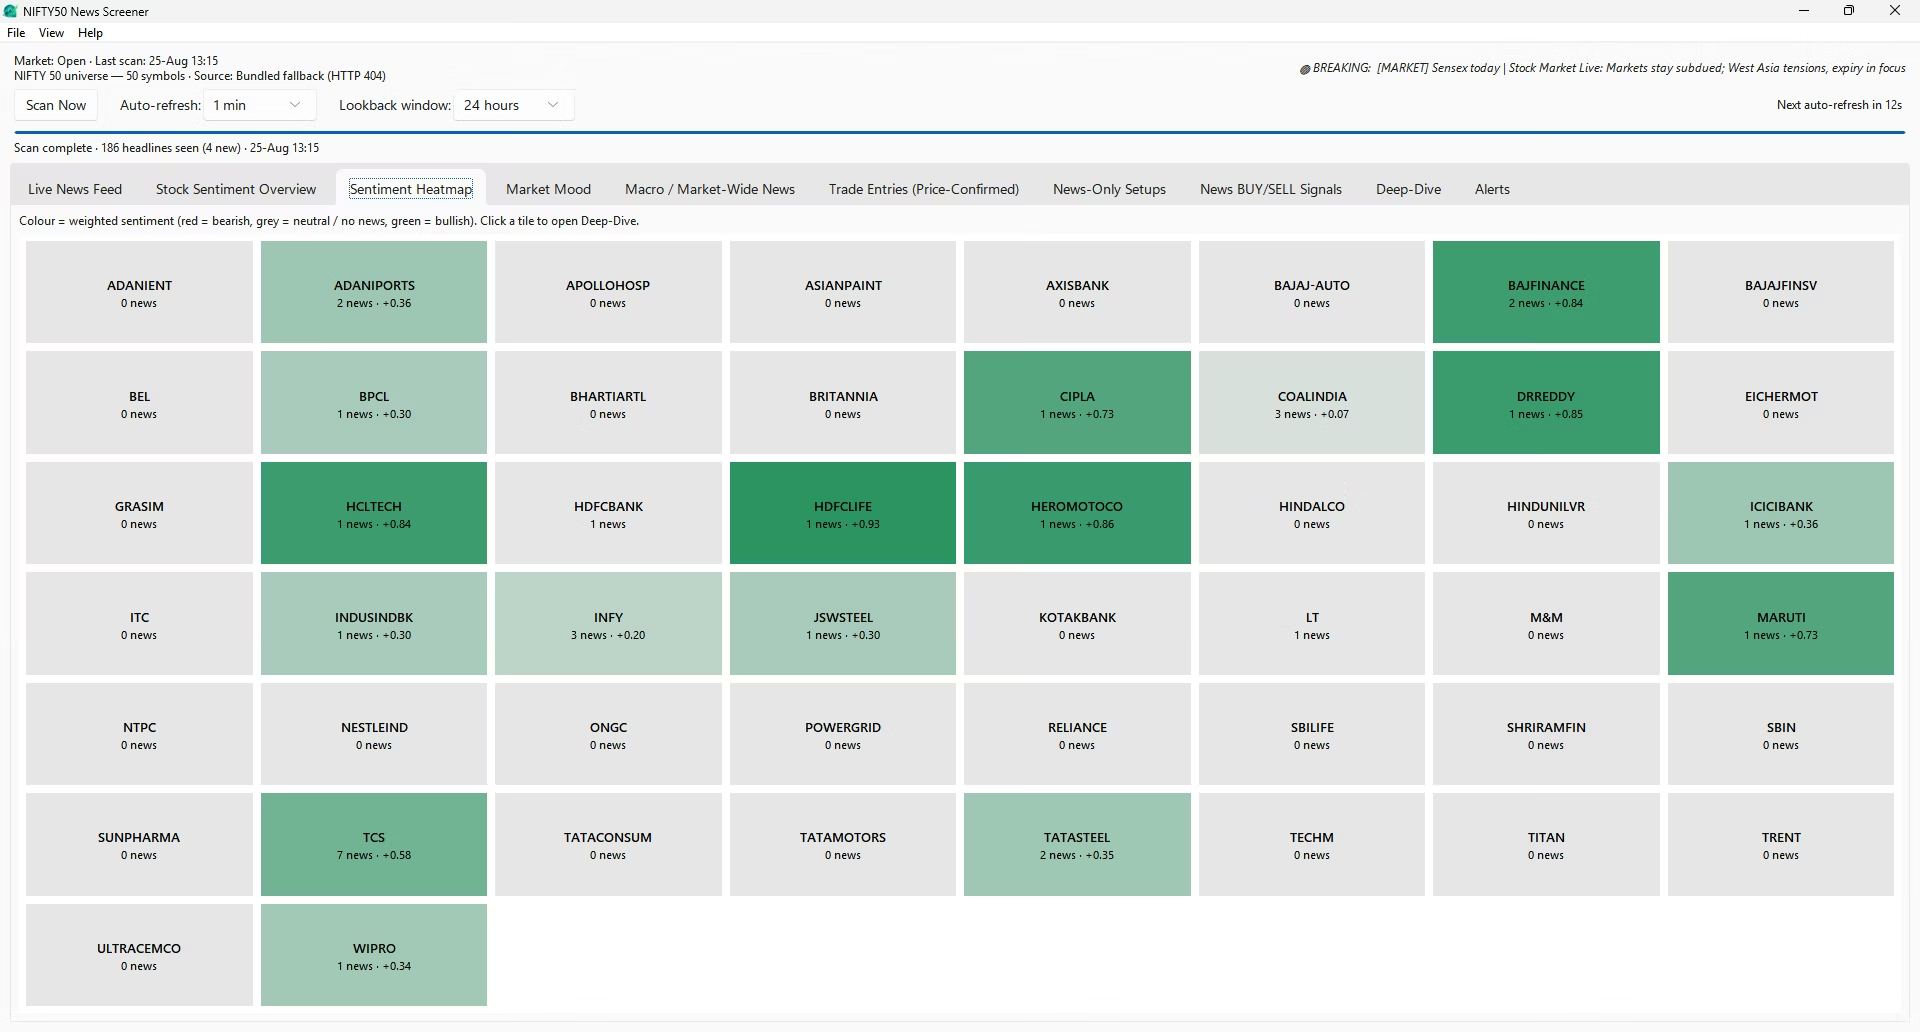
The same fifty stocks rendered as a grid of coloured tiles rather than a table. Green shades mean bullish coverage, red shades mean bearish, and grey means either no news or a genuinely neutral reading. Colour depth encodes magnitude: the darker the tile, the stronger the weighted sentiment behind it.
This is the tab for the first ten seconds of your session. A table of fifty rows requires reading; a heatmap requires only looking. If eleven tiles are dark red and clustered in banking names, you have learned something about the day before you have read a single headline. Clicking any tile jumps straight to that stock's Deep-Dive, so the heatmap doubles as the fastest navigation device in the application.
-
Market Mood
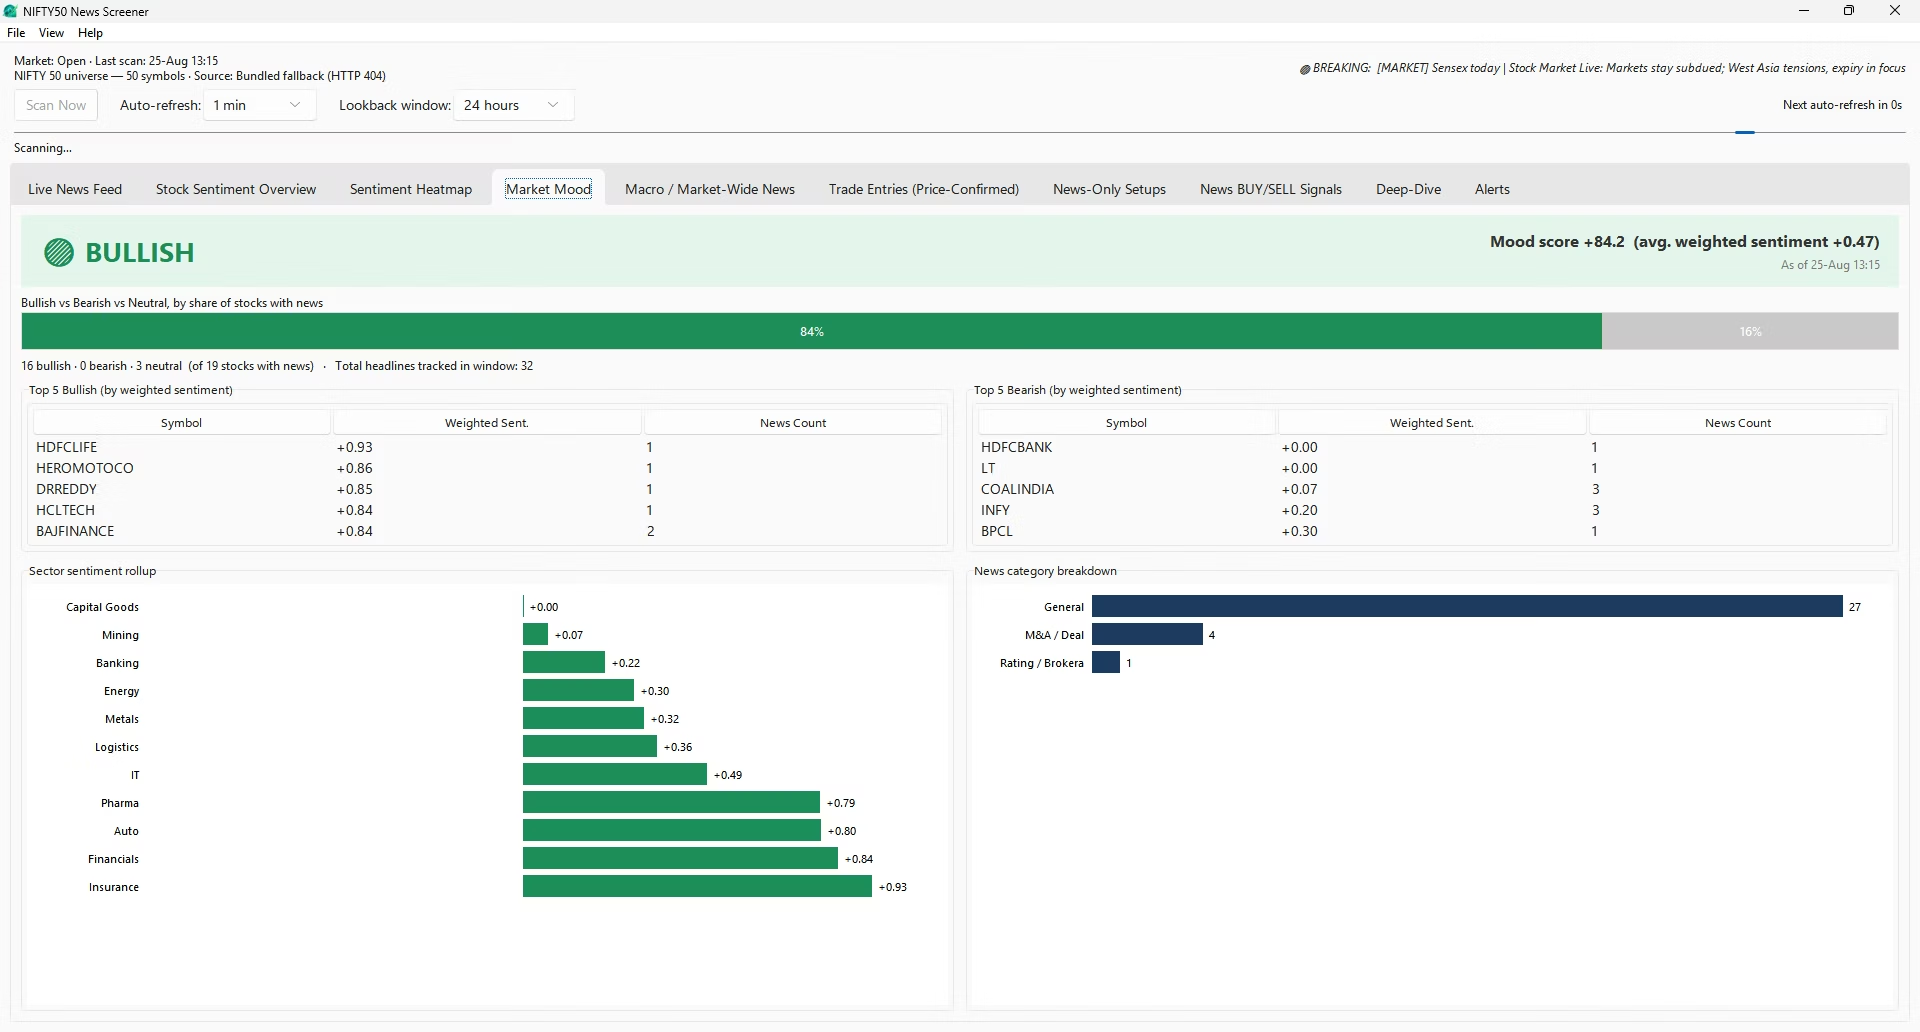
A single index-wide read, assembled from five components stacked on one screen.
- The mood banner. A colour-coded verdict — Bullish, Mildly Bullish, Neutral-Mixed, Mildly Bearish or Bearish — with a mood score printed alongside it. The score is simply the bullish share of stocks with news minus the bearish share, expressed on a −100 to +100 scale, and the label is a threshold on that number. No hidden weighting, no black box.
- The stacked split bar. Bullish, bearish and neutral shares of the covered universe drawn as one horizontal bar, so you can see whether a +18 mood score comes from a broad tilt or from four extreme outliers.
- Top 5 bullish and Top 5 bearish. Two small leaderboards ranked by weighted sentiment, each with the stock's headline count beside it so a single-story spike is distinguishable from sustained coverage. Double-click either to open the Deep-Dive.
- Sector rollup. Sentiment aggregated across the sector map — Banking, IT, Auto, FMCG, Pharma, Metals, Energy, Power, Cement, Insurance, Financials, Telecom, Healthcare, Consumer, Retail, Logistics, Mining, Capital Goods, Industrials and Conglomerate — drawn as a signed bar chart. Rotations show up here long before they show up in a single stock's row.
- Category breakdown. How today's Nifty 50 stock news splits across Earnings, M&A, Regulatory, Rating, Management, Corporate Action, Product and Macro. A results-season day and a regulatory-crackdown day look nothing alike here, and knowing which one you are in changes how much weight sentiment deserves.
-
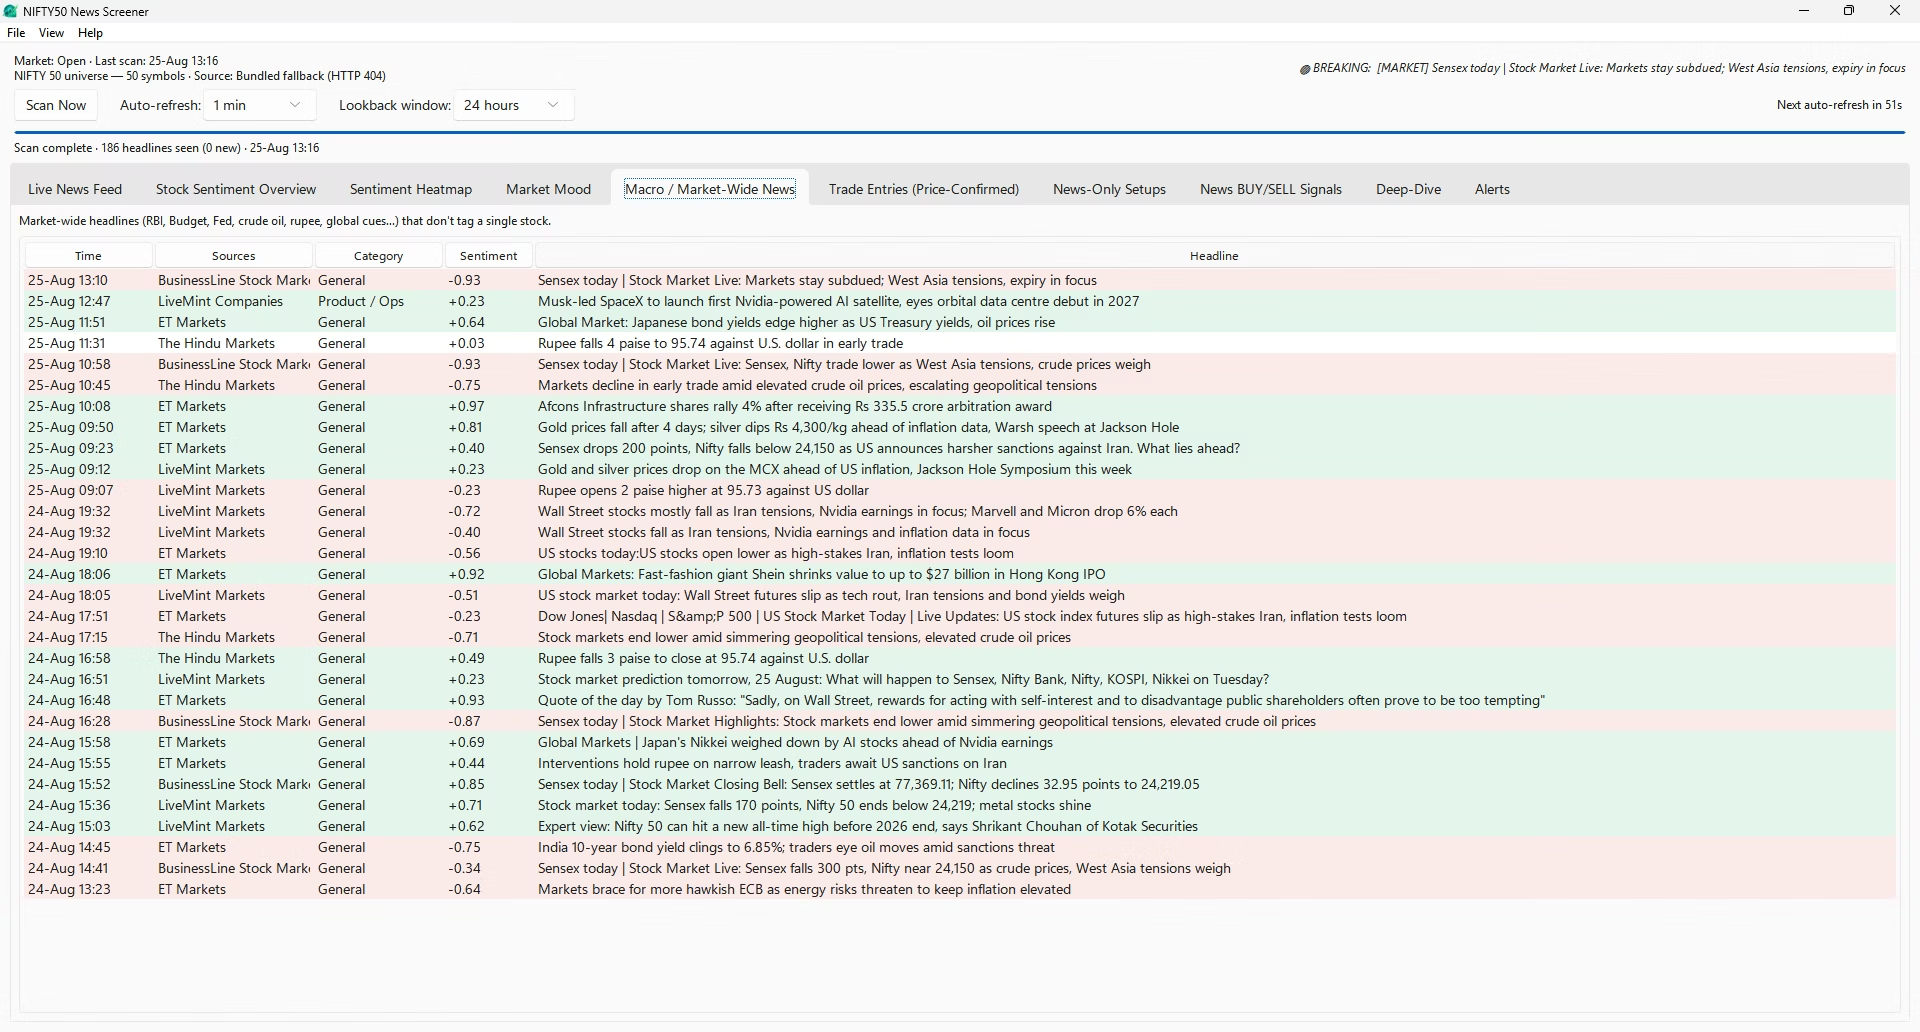
Macro / Market-Wide News
Some of the most important stories on any given day name no company at all. A repo-rate decision, a Budget announcement, a Federal Reserve statement, a move in crude, a slide in the rupee, an FII outflow number, a change in import duty or a sovereign rating action moves the whole index without ever appearing in a stock-tagged feed.
The screener carries a macro keyword list covering exactly this territory — the central bank, monetary policy, inflation prints, GDP, fiscal deficit, the Union Budget, crude and Brent, the rupee and the dollar index, institutional flows, GST collections, industrial production, trade deficit, forex reserves, the ratings agencies, index levels, bond yields, tariffs and duties, index inclusion, and global cues from Wall Street and China. Any headline matching one of these but naming no constituent is routed here instead of being discarded.
The layout mirrors the Live News Feed — time, sources, category, sentiment, headline — with the same colour coding and the same double-click-to-open behaviour. Treat it as context: when the macro tab is a wall of red, the individual stock reads on every other tab deserve to be discounted, because the whole tape is being priced off one story.
-
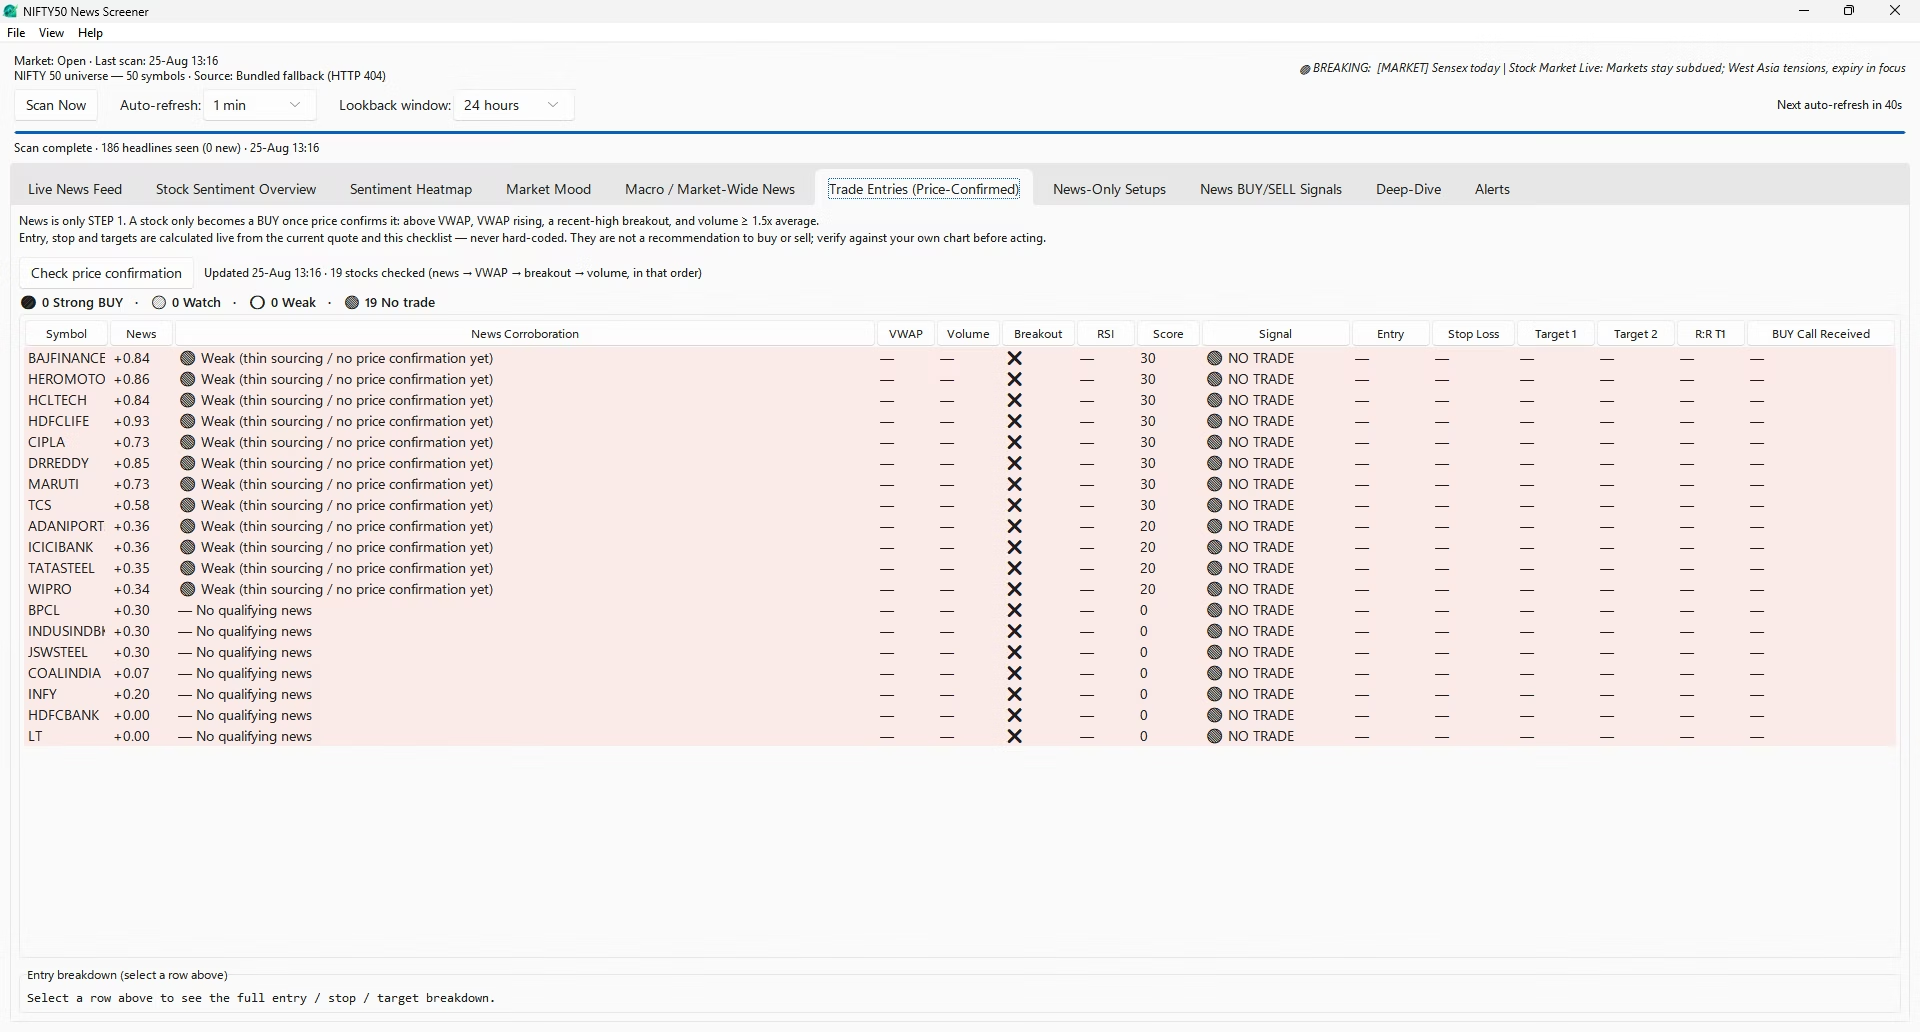
Trade Entries (Price-Confirmed)
The most conservative of the three signal layers, and the only one that asks price to agree before it calls anything a setup. The premise is straightforward: a bullish headline is a reason to look, not a reason to buy. Before a row here becomes a signal, the live quote has to confirm the story.
Press Check price confirmation and the app fetches a live price snapshot for the constituents currently carrying the strongest sentiment — capped at twenty symbols per pass so the fetch stays quick — and runs each through a points checklist:
Condition Points Why it is on the list News sentiment above +0.30 +20 There has to be a story worth acting on in the first place. News sentiment above +0.50 +10 An extra weighting for unusually strong coverage. Price above VWAP +20 Buyers, not sellers, are in control of the session so far. VWAP rising +10 That control is strengthening rather than fading. Volume at or above 1.5× its recent average +15 Participation is confirming the move rather than drifting. Breakout of the 15-minute high +20 Price has actually broken structure, not merely wobbled. RSI between 50 and 70 +5 Healthy strength, short of the overbought zone. Index trend bullish on the day +10 The setup is swimming with the tape, not against it. Price below VWAP −20 A direct contradiction of the bullish thesis. Weak volume confirmation −15 Nobody is showing up for the move. The total is clamped to a 0–100 band. Eighty and above reads Strong BUY setup; 65 to 79, Watch or wait for confirmation; 50 to 64, Weak; below 50, No trade. A second modifier sits on top: if the score is high but the news behind it comes from a single thin source with no corroboration, the label is demoted to a cautious watch rather than a buy. Three headlines plus price confirmation reads Strong; one headline plus price confirmation reads Moderate; thin sourcing with no price confirmation reads Weak, whatever the arithmetic says.
Levels are only produced when there is genuinely something to trade. At a score of 65 or higher, with a real breakout in progress, the app computes an entry at the breakout level itself, a stop at whichever is nearer of VWAP or a tight buffer beneath the breakout, and two targets at 1.5 times and 3 times the resulting risk, with the risk-to-reward ratio shown for each. Every one of these numbers comes from the live quote and the tick history — none of them are hard-coded percentages.
The table carries a BUY Call Received column that records when a symbol first turned into a Strong BUY. It keeps that original timestamp across repeated manual checks and only resets if the signal lapses entirely and a fresh one fires later, so you can tell a signal that has been live for forty minutes from one that just appeared. Single-clicking a row opens the full entry, stop and target breakdown beneath the table; double-clicking opens the Deep-Dive.
Entry, stop and targets are calculated live from the current quote and this checklist — never hard-coded. They are not a recommendation to buy or sell. Verify against your own chart before acting.
-
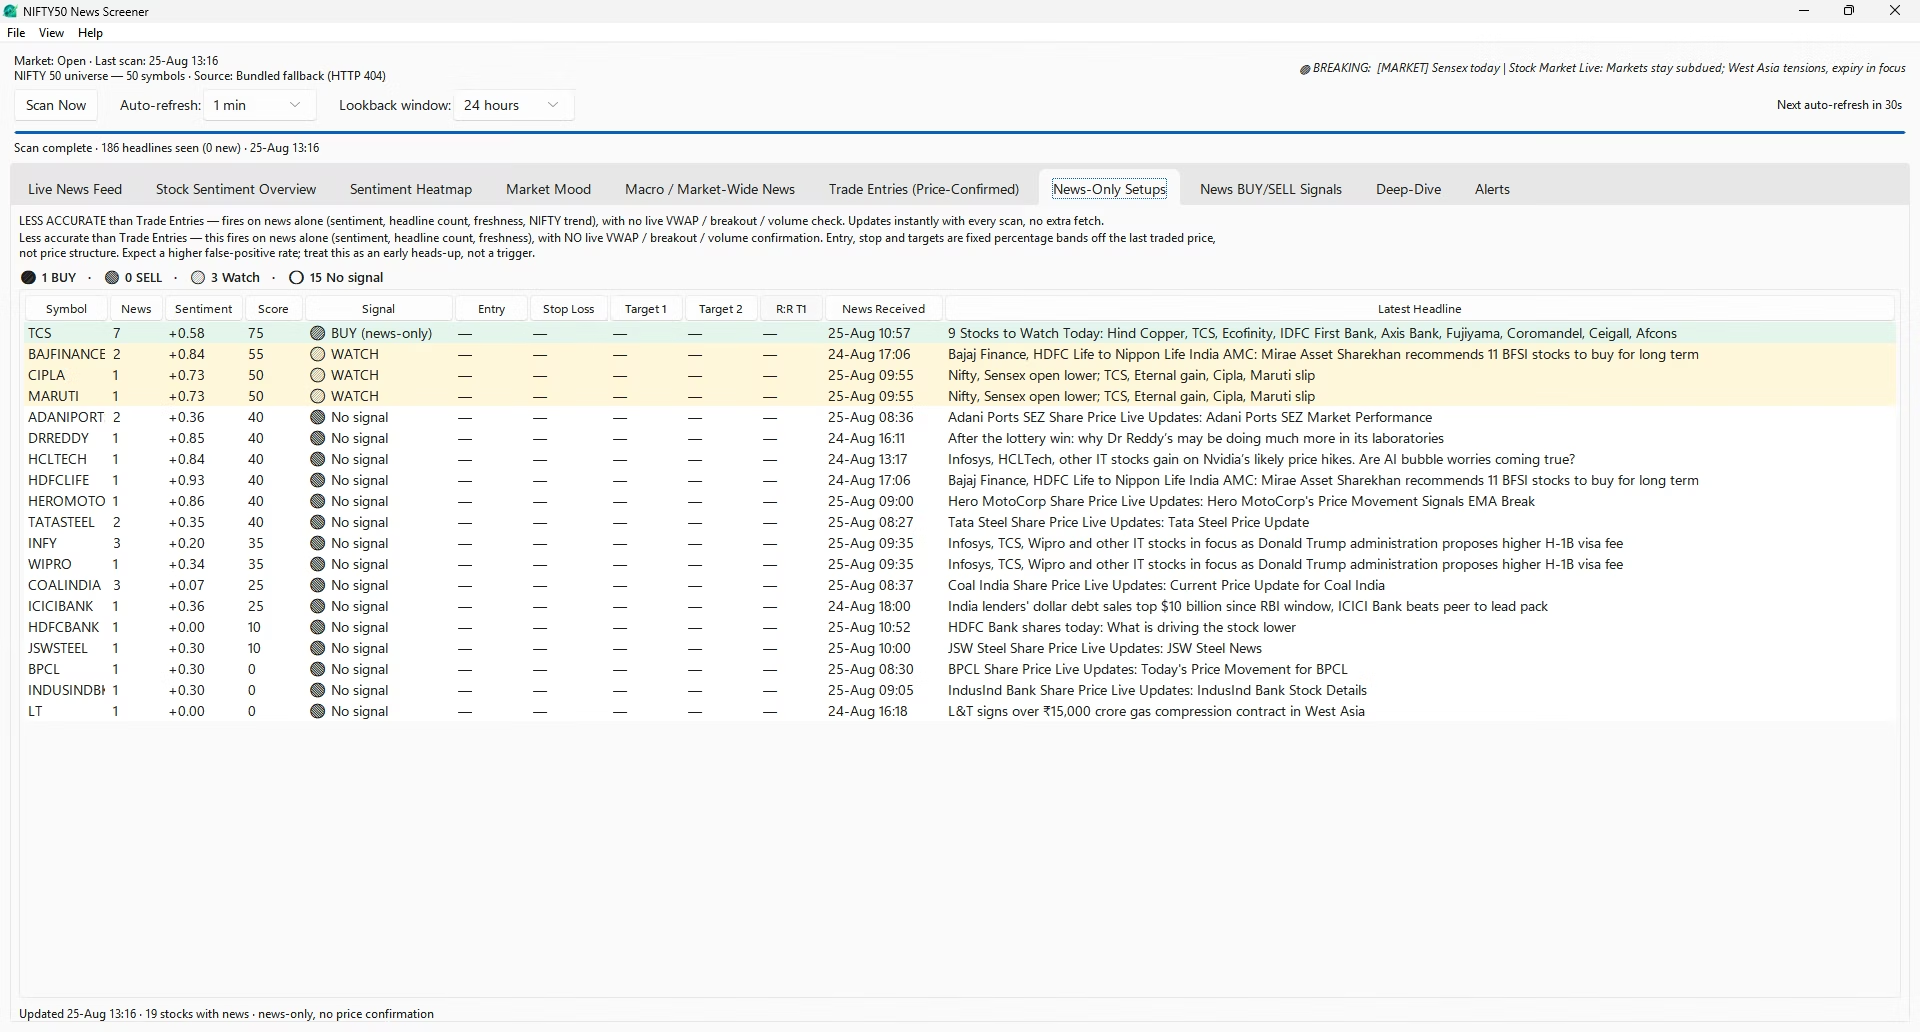
News-Only Setups
The same idea with the price gate removed. This layer scores purely on the news — sentiment magnitude, how many headlines exist, how fresh the latest one is, and whether the direction agrees with the index's move on the day — and it never waits for VWAP, a breakout or a volume check.
The trade-off is stated openly inside the app rather than buried: this fires sooner and more often, and it is materially less reliable. Sentiment magnitude above 0.30 earns 25 points and above 0.50 another 15; two or more headlines earn 15 and three or more another 10; a latest headline under an hour old earns 20, or 10 if it is between one and four hours old; agreement with the index trend adds a final 10. Seventy or above reads as a strong directional call, 50 to 69 as a watch, and anything lower shows no signal.
Where levels are shown, they are fixed percentage bands off the last traded price rather than price structure: a 1.2 percent stop on a strong reading or 1.8 percent on a watch, with targets at 2 percent and 3.5 percent. That is a deliberately blunt instrument, and it is labelled as one.
This tab updates automatically with every scan. It adds no extra network call and no extra lag, because it only reads data the scan has already gathered. Treat it as an early heads-up worth investigating, not as a trigger — and if a symbol here later appears on the price-confirmed tab, that is precisely the sequence the software is designed to show you.
-
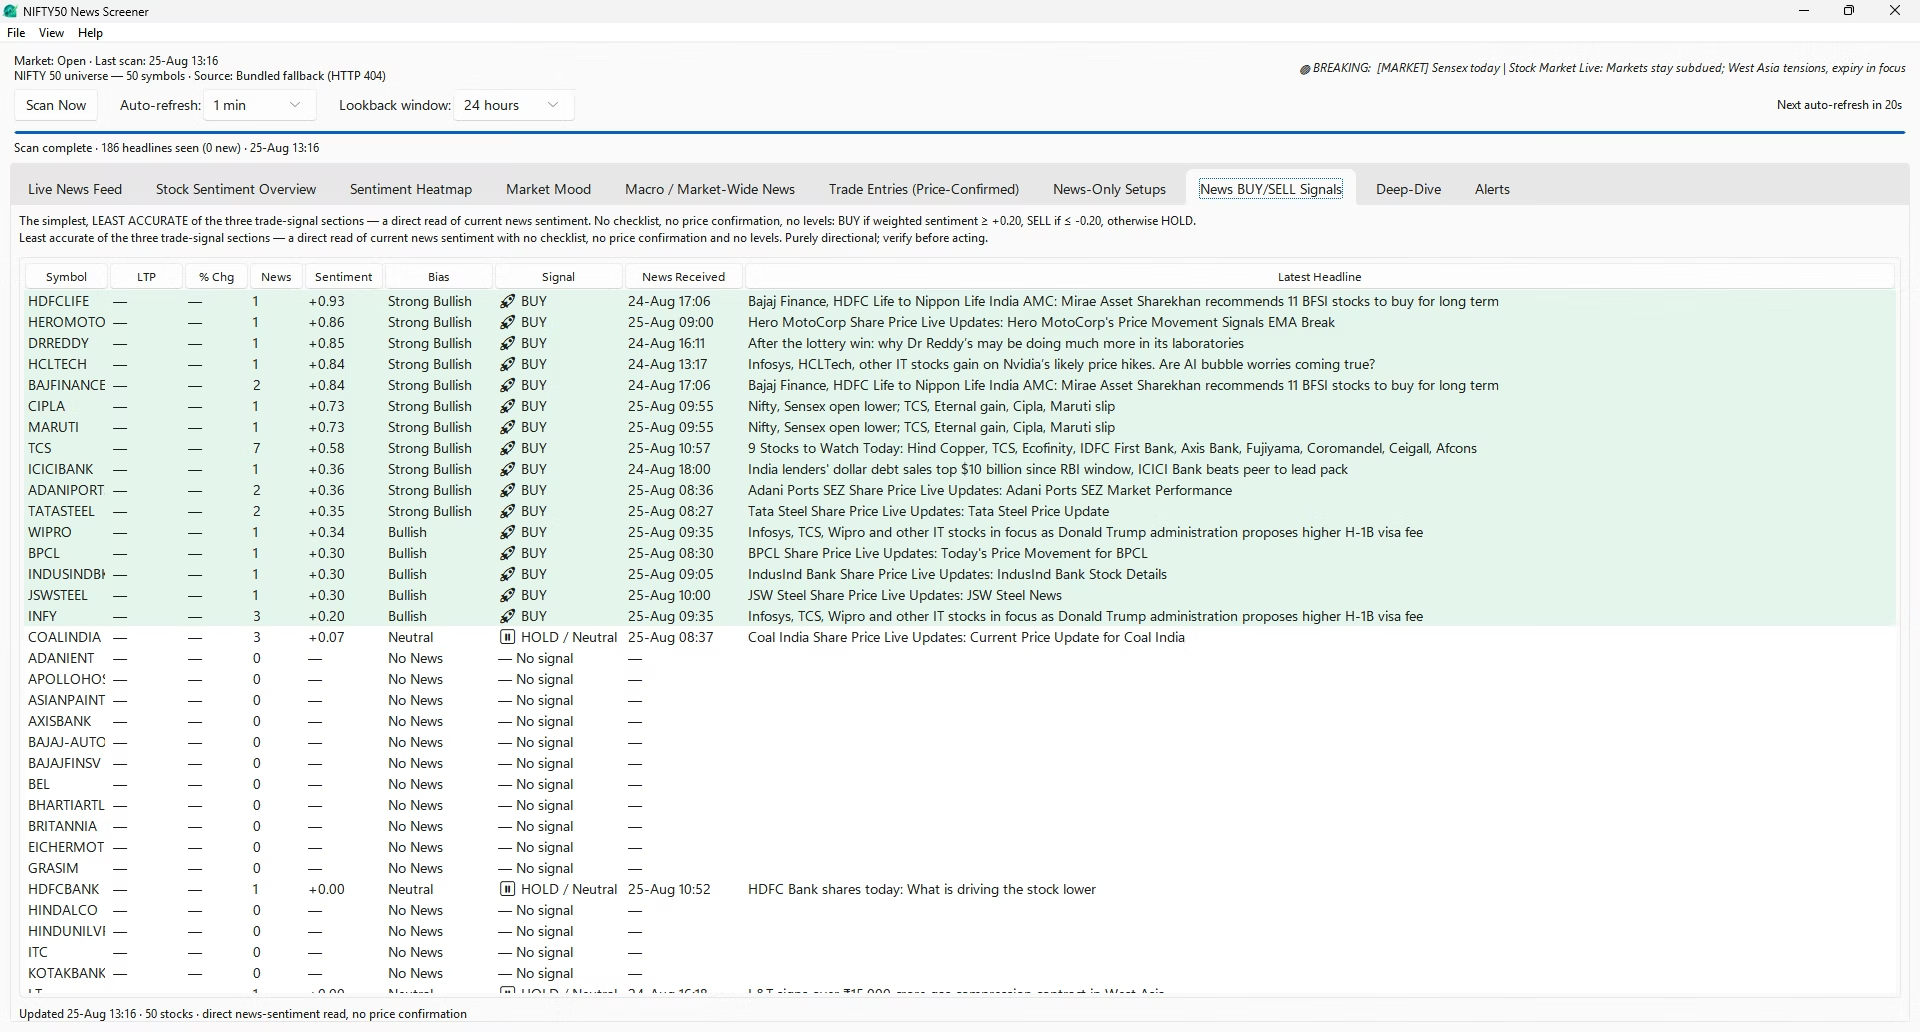
News BUY/SELL Signals
The simplest read in the application, and the one the documentation is most careful to qualify. There is no checklist, no score, no entry and no stop — just a direct mapping from the current weighted sentiment on each stock to a plain verdict. At or above +0.20 it prints BUY; at or below −0.20 it prints SELL; in between it prints HOLD or Neutral; with no qualifying news it prints nothing at all.
The table shows nine columns: symbol, last traded price, percentage change, headline count, weighted sentiment, bias label, the signal itself, the time the latest story arrived, and that headline. If what you want is a fast directional read across the whole index — the Nifty 50 buy sell signals in their most compressed possible form — this is the tab that gives it, updated automatically on every scan.
Being the least filtered of the three layers, it is also the noisiest. A single strongly worded headline on a thinly covered stock is enough to flip a row here. The application says so directly in its own help text, and it is worth repeating: this is a quick read, not a setup. Double-click a row to move to the Deep-Dive and find out what is actually behind the number.
-
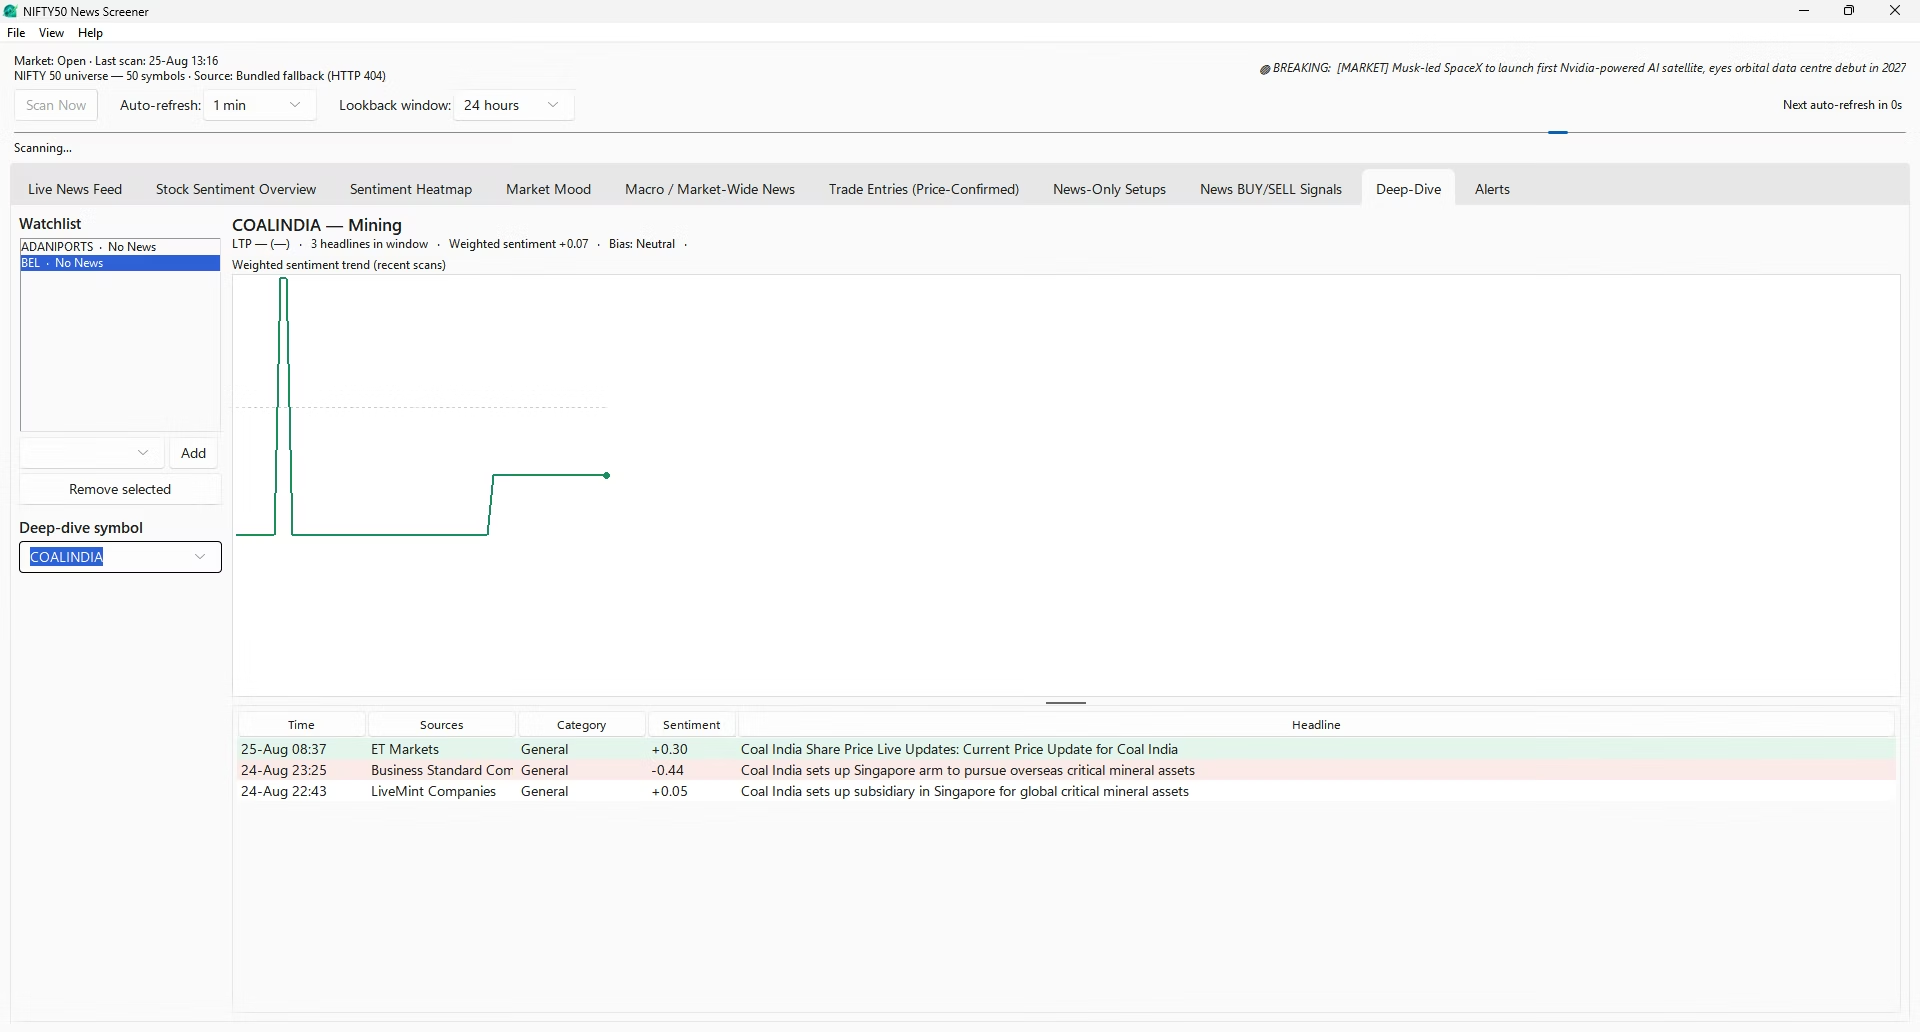
Deep-Dive
The per-stock view, and the destination of nearly every double-click elsewhere in the application. Choose any constituent from the dropdown — or arrive by clicking a heatmap tile, an overview row, a leaderboard entry, an alert or a signal row — and you get its complete accumulated history.
- A sentiment trend chart drawn from stored snapshots, so it shows how tone on this stock has moved over hours and days rather than only within the current window.
- Every recent headline about the stock in a sortable table with time, sources, category, sentiment and title. Double-click to open the original article.
- The latest price technicals for the symbol, alongside the news, so the two halves of the picture sit on one screen.
- A resizable split pane between chart and table — drag the divider to give either side more room, depending on whether you are reading or looking.
- The Watchlist panel on the left, where you add or remove symbols. This is a personal shortlist that stars matching entries in the Alerts tab; it is emphatically not a restriction. Scanning and alerting always cover all fifty constituents regardless of what is in it.
-
Alerts
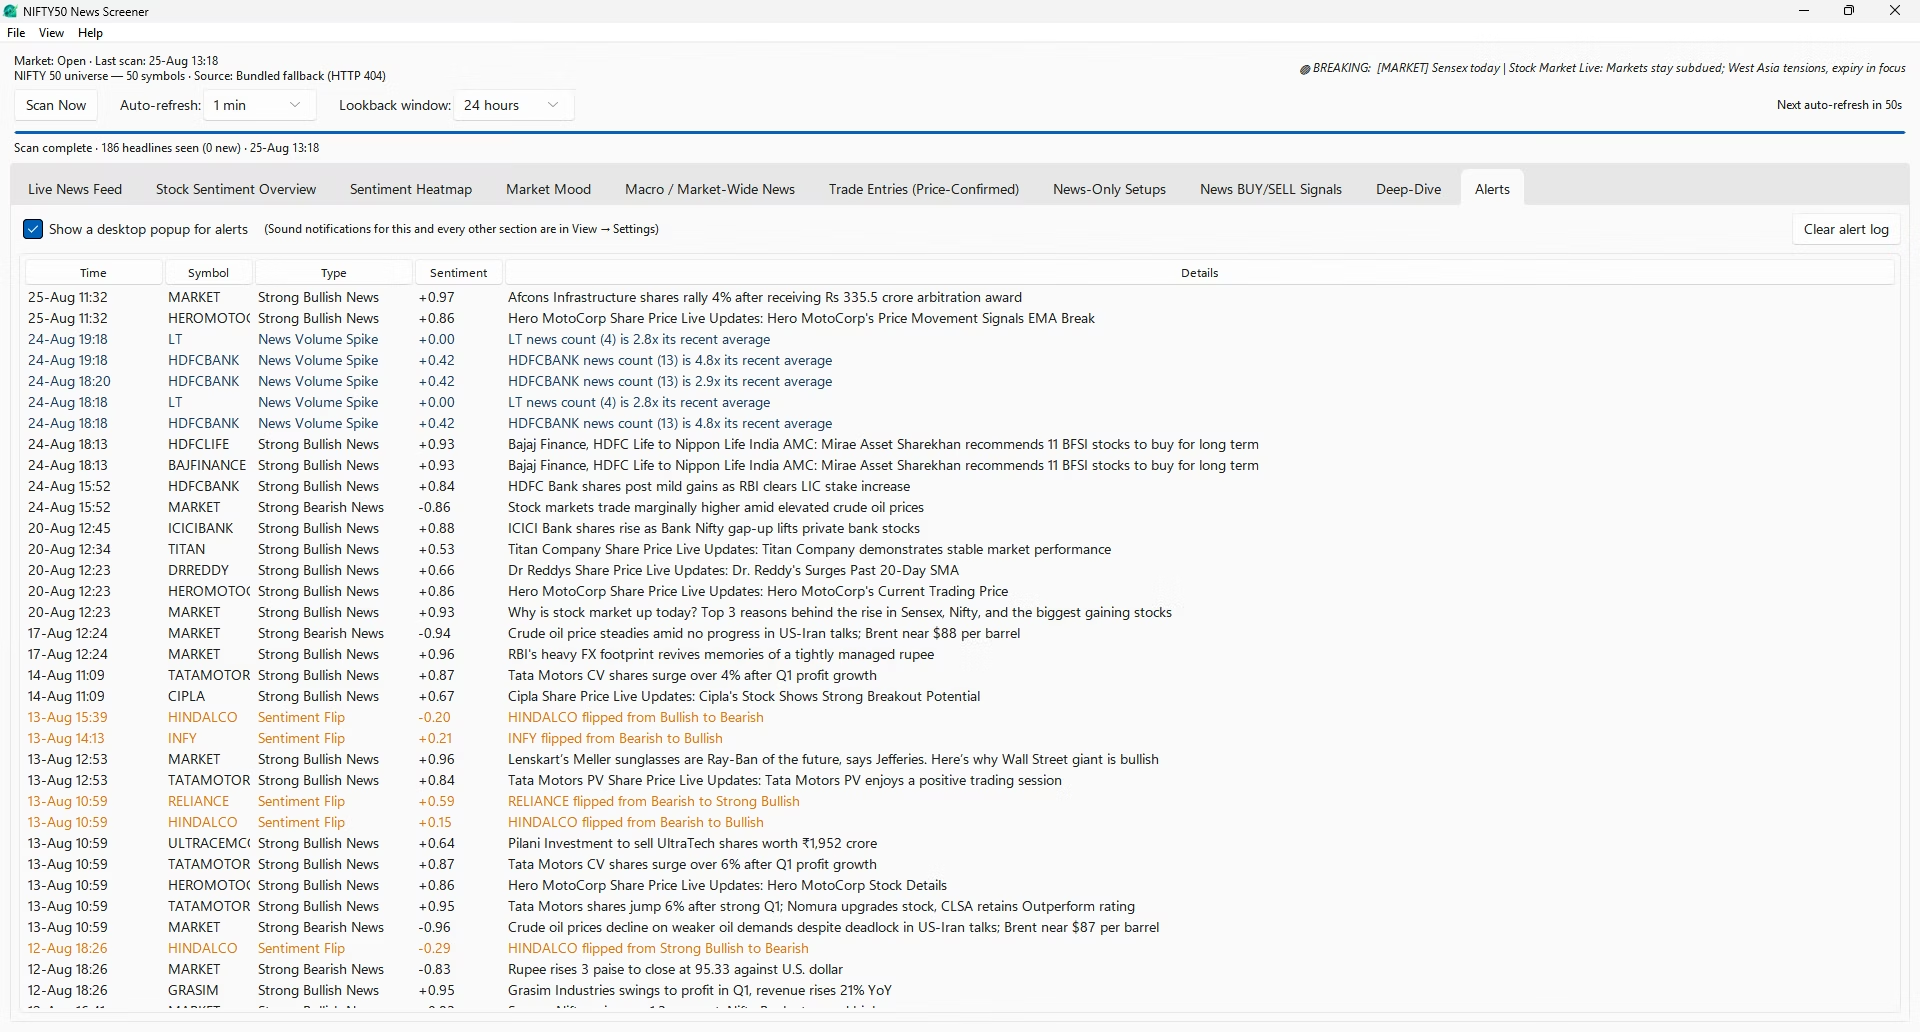
A running log of everything the application has flagged on its own, across the whole index, with five columns: time, symbol, alert kind, sentiment and message. Three kinds of event get written here.
- Strong bullish or bearish news. A single headline whose sentiment magnitude reaches 0.5 with sufficient intensity behind it. One story, strongly worded, worth knowing about immediately.
- Sentiment flips. A stock whose bias has crossed from bullish to bearish or the reverse, with at least two headlines supporting the new state so that a lone outlier cannot trigger it. These are often the most useful rows in the log, because a reversal in tone is more informative than a continuation of it.
- News volume spikes. A stock whose headline count has reached at least three and at least two and a half times its own recent baseline. Something is developing, whatever direction it eventually resolves in.
A desktop pop-up toggle lives on this tab; watchlist symbols are marked with a star in the toast title so you can tell your shortlist apart at a glance. Sound is configured separately, per section, in Settings. Double-clicking a row with a recognised symbol opens that stock's Deep-Dive, and a Clear alert log button permanently wipes the history when it gets long.
Three layers of Nifty 50 buy sell signals, ranked by how much they ask for
Most tools give you one signal and let you assume it is reliable. This one gives you three and tells you, in its own interface, which is the weakest.
| Trade Entries Price-confirmed | News-Only Setups Sentiment scored | News BUY/SELL Direct read | |
|---|---|---|---|
| Relative reliability | Highest of the three | Middle | Lowest by design |
| Requires live price | Yes — VWAP, breakout, volume | No | No |
| Inputs | Sentiment, VWAP, VWAP slope, volume ratio, 15- and 5-minute breakout, RSI, index trend, source corroboration | Sentiment magnitude, headline count, headline freshness, index trend agreement | Weighted sentiment only |
| Scoring | Weighted checklist, 0–100, with penalties | Weighted checklist, 0–100 | None — a threshold |
| Thresholds | 80+ strong buy · 65+ watch · 50+ weak | 70+ strong · 50+ watch | ±0.20 to fire |
| Levels given | Entry at breakout, stop at VWAP or tight buffer, targets at 1.5R and 3R | Fixed percentage bands: 1.2–1.8% stop, 2% and 3.5% targets | None |
| Updates | On demand, via the confirmation button | Automatically, every scan | Automatically, every scan |
| Speed | Slowest to fire | Fast | Immediate |
| False positives | Fewest | Materially more | Most |
| Best used as | A shortlist to take to your own chart | An early heads-up worth watching | A directional temperature check |
The sixteen news sources, and what each one counts for
Every feed is always on. The weight column is the reliability multiplier applied to that outlet's headlines throughout the sentiment calculation.
| Source | Coverage | Weight |
|---|---|---|
| Reuters India | Wire-service Indian business news | 1.00 |
| LiveMint Markets | Markets desk | 0.90 |
| LiveMint Companies | Company and corporate news | 0.85 |
| Business Standard Markets | Markets desk | 0.85 |
| Business Standard Companies | Company news | 0.85 |
| Business Standard Stock Market | Stock-market specific | 0.85 |
| CNBC TV18 Markets | Broadcast markets desk | 0.85 |
| Moneycontrol Business | Business desk | 0.85 |
| The Hindu Markets | Markets section | 0.85 |
| BusinessLine Stock Markets | Stock-market section | 0.85 |
| Financial Express Markets | Markets desk | 0.80 |
| Economic Times Markets | Markets desk | 0.80 |
| Zee Business Markets | Markets desk | 0.80 |
| Moneycontrol Latest News | General latest-news firehose | 0.75 |
| Indian Express Market | Market section | 0.75 |
| Financial Express Business | General business feed | 0.75 |
Feeds are fetched concurrently, so total scan time is governed by the slowest publisher rather than the sum of all sixteen. A feed that is temporarily unreachable is skipped for that pass without halting the scan, and the remaining sources still produce a complete result.
How every headline gets categorised
Eight buckets, matched on keyword patterns in a fixed order. The category is a filter on the feed, a column in the tables, and a chart on the Market Mood tab.
Earnings
Quarterly results, net profit and loss, EBITDA, revenue moves, beats and misses against estimates, results previews and earnings calls.
M&A / Deal
Acquisitions, mergers, stake sales, joint ventures, divestments, buyouts and takeovers.
Regulatory / Legal
Regulator action, probes, raids, penalties, fines, lawsuits, court matters, competition-authority reviews, fraud allegations and show-cause notices.
Rating / Brokerage
Upgrades, downgrades, target price changes, buy and sell ratings, overweight and underweight calls, and coverage initiations.
Management
Chief executive and chief financial officer changes, resignations, appointments, board approvals and chairmanship moves.
Corporate Action
Dividends, bonus issues, stock splits, buybacks, rights issues and record dates.
Product / Ops
Launches, new plants, capacity expansion, contract and order wins, partnerships, tie-ups and collaborations.
Macro
Anything that moves the whole tape without naming a constituent — routed to its own tab rather than tagged to a stock.
Categories change how much a score deserves to be trusted. A strongly positive reading built entirely on brokerage upgrades is a different object from one built on an order win and a capacity expansion, and the Market Mood category chart exists precisely so you can tell which kind of day you are looking at before you act on any Nifty 50 buy sell signals the screener produces.
Coverage: all fifty constituents, mapped to sectors
The universe is fetched live from the exchange at startup, so index reconstitutions are picked up automatically rather than requiring a software update.
Each scan explicitly covers all fifty names by ticker and by brand alias. There is no watchlist restriction on scanning, on sentiment aggregation or on alerting — the watchlist inside the Deep-Dive tab is a personal shortlist that stars matching rows in the alert log, nothing more.
If the live fetch from the exchange fails, the app falls back first to its local cache of the last successful fetch and then to a bundled fifty-symbol list, so a scan is never blocked by a network hiccup. Alongside the constituent list, the same request supplies each stock's last traded price and percentage change, which is what populates the price columns on the Overview and signal tabs.
Every symbol also carries a sector tag used for the sector rollup on the Market Mood tab, spanning Banking, Financials, Insurance, IT, Auto, FMCG, Consumer, Retail, Pharma, Healthcare, Metals, Mining, Cement, Energy, Power, Telecom, Logistics, Capital Goods, Industrials and Conglomerate. Sector-level tone is often where a rotation becomes visible first — four banking names drifting bearish together says something that no single row does.
The app is aware of the trading session, distinguishing pre-open from open, closed and weekend, so it behaves sensibly outside market hours. News scanning continues regardless of session, because Nifty 50 stock news does not stop when the bell rings — results are published after hours, regulators act in the evening, and global cues arrive overnight.
The alert engine in detail
Three trigger types, all evaluated on every scan, all covering the entire index rather than a subset.
Strong single headline
Fires when a newly arrived headline scores at least 0.5 in magnitude with enough intensity behind it to rule out weakly worded matches. The toast names the stock and the direction; the log records the headline verbatim.
Sentiment flip
Fires when a stock's bias crosses from bullish to bearish or the reverse — not merely drifting within a band, but changing side — and only when at least two headlines support the new state, so a single outlier cannot cause one.
News volume spike
Fires when a stock's headline count in the window reaches at least three and at least two and a half times its own rolling baseline. Direction-agnostic: it tells you something is developing, not which way it will resolve.
Desktop toasts are toggled on the Alerts tab itself. Sound is configured per section in Settings, with separate switches for alerts, price-confirmed entries, news-only setups and the direct buy-sell read — and a beep fires only when a section produces a genuinely new signal, not repeatedly for the same ongoing one. Watchlist symbols appear with a star in the toast title so your shortlist is distinguishable at a glance, while still leaving all fifty stocks covered.
Local history, privacy and your data
Everything the screener learns stays on your machine, in a database you can export or delete at any time.
What is stored, and where
A single history file in a folder under your Windows user profile holds every headline the app has seen, the per-stock sentiment snapshots that draw the trend charts, the price ticks used for the confirmation checklist, and the full alert log. Old price ticks are cleared automatically so it does not grow without bound.
The exact path is printed in the Settings window. It is an ordinary file — you can back it up or copy it to another machine like any other document.
What leaves your machine
Three things, and nothing else: requests to the exchange for the constituent list and last-traded prices, requests to the sixteen public RSS feeds, and a single licence-verification call to the payment platform when you activate. No headline, no watchlist, no alert and no usage data is sent anywhere.
There is no account, no telemetry and no cloud sync. A Clear local history button in Settings permanently wipes all stored news, snapshots and alerts from the machine, and an Export all visible news to CSV button takes a copy out first if you want one.
Who this Nifty 50 stock screener is built for
Four fairly different working styles use this Nifty 50 stock screener in four fairly different ways, each drawing on a different subset of the same ten tabs.
The intraday trader
Runs a 15- or 30-second auto-refresh with a one-hour lookback, lives on the Live News Feed and the price-confirmed Trade Entries tab, and keeps sound on for strong buy setups only. Uses the app as an alerting layer beside a charting platform, never instead of one.
The swing trader
Runs a one- or two-minute refresh with a two- to three-day lookback, works mostly from the Overview and the Deep-Dive trend charts, and treats sentiment flips as the primary alert worth reacting to.
The long-term investor
Opens it once or twice a day with a seven-day window, checks the heatmap and the sector rollup for anything unusual in held names, and largely ignores the three signal tabs. For this user the value is not missing a regulatory story on a stock they own.
The analyst or student
Uses the CSV export as a dataset. A week of categorised, sentiment-scored, source-attributed Nifty 50 news is genuinely hard to assemble by hand and immediately useful for coursework, research notes or a personal model.
Who it is not for
Anyone looking for automated order placement, portfolio tracking, option chains, futures data, backtesting, or a system that promises a win rate. None of those exist here, and the application makes no claim about accuracy anywhere in its interface.
Screenshots
Use the arrows on either side to move through the tour. Click any image to open it full size. All screenshots are from the current release.
System requirements
Modest. This is a desktop Nifty 50 stock screener, not a platform, and it is sized accordingly.
| Item | Requirement |
|---|---|
| Operating system | Windows 10 or Windows 11, 64-bit |
| Installation | None required — a single program file you run directly |
| Dependencies | None. Everything the app needs is contained inside it |
| Memory | 4 GB RAM is comfortable; 8 GB if you keep a seven-day lookback window open all day |
| Disk | Roughly 200 MB for the application, plus a slowly growing local news history |
| Display | 1366×768 minimum; 1920×1080 or wider is much better for the twelve-column tables |
| Internet | Required. The app fetches sixteen RSS feeds and exchange data on every scan |
| Broker account | Not required and not supported. The screener never connects to a broker or places an order |
| Licence | One key, verified once at activation, then cached locally |
Only one copy of the application runs at a time. A second window is prevented from opening and writing to the same history, so you cannot accidentally corrupt your data by double-clicking the icon twice.
Stop reading sixteen tabs of Nifty 50 news. Read one screen.
The Nifty 50 News Screener is a one-time purchase with no subscription, no account and no recurring fee. It runs on your Windows desktop, stores its history on your own machine, and covers every constituent of the index on every pass.
Glossary
The Nifty 50 news and sentiment terms this page and the application use, defined once.
| Term | Meaning inside this application |
|---|---|
| Weighted sentiment | The source-weighted, recency-decayed average sentiment of all clustered headlines about a stock inside the current lookback window. Runs roughly from −1 to +1. |
| Bias label | A plain-language band on weighted sentiment: Strong Bullish, Bullish, Neutral, Bearish, Strong Bearish, or No News. |
| Lookback window | How far back stories count toward every statistic on screen. Adjustable from one hour to seven days, applied instantly from local history. |
| Corroboration | How many independent outlets carried the same clustered story, and whether price has confirmed it. Shown as Strong, Moderate or Weak. |
| Recency decay | The eight-hour half-life applied to each headline's contribution, so fresh news outweighs old news automatically. |
| Confirmation score | The 0–100 checklist total on the price-confirmed Trade Entries tab, combining news, VWAP, volume, breakout, RSI and index trend. |
| VWAP | Volume-weighted average price for the session. Price above a rising VWAP is treated as evidence buyers are in control. |
| Breakout | Price exceeding the high of the last fifteen minutes, with a tighter five-minute window as a secondary check. |
| Volume surge | Current volume at or above 1.5 times its recent average across the last ten scan ticks. |
| R and R-multiple | R is the distance from entry to stop. Targets are placed at 1.5R and 3R on the price-confirmed tab. |
| Sentiment flip | A stock crossing from bullish to bearish or the reverse, with at least two headlines behind the new state. |
| News volume spike | A stock's headline count reaching three or more and at least 2.5 times its own recent baseline. |
| Macro headline | A story matching the market-wide keyword list that names no individual constituent, routed to its own tab. |
Frequently asked questions
Thirty-five questions people ask before and after buying, answered without marketing language.
What is the Nifty 50 News Screener?
It is a Windows desktop application that continuously scans sixteen Indian financial news feeds, scores every headline for sentiment using a finance-tuned model, tags each story to the correct Nifty 50 constituent, and presents the result as a live dashboard of ten tabs covering raw Nifty 50 news, per-stock aggregation, market mood and three layers of Nifty 50 buy sell signals.
How is this different from an ordinary Nifty 50 stock screener?
A conventional Nifty 50 stock screener filters on numbers: price, volume, moving averages, valuation ratios. This one filters on language. Its inputs are headlines rather than candles, which means it surfaces the cause of a move rather than the move itself. The two are complementary — this application is designed to sit beside your charting platform, not to replace it.
Does it predict where a stock will go?
No, and it says so in several places inside its own interface. It measures how the press is currently writing about a company. Sentiment is a noisy probabilistic input, and no accuracy percentage is claimed for it anywhere in the application or on this page.
How often does it refresh?
Auto-refresh can be set to off, 15 seconds, 30 seconds, 1 minute, 2 minutes, 5 minutes or 10 minutes, with one minute as the default. A countdown to the next pass is always visible, and you can force an immediate scan at any time with the Scan Now button.
Which news sources does it read?
Sixteen public RSS feeds from Reuters India, LiveMint (Markets and Companies), Business Standard (Markets, Companies and Stock Market), CNBC TV18, Moneycontrol (Business and Latest News), The Hindu, BusinessLine, Financial Express (Markets and Business), Economic Times Markets, Zee Business and Indian Express Market. Each carries a reliability weight between 0.75 and 1.00 that follows its headlines through the sentiment calculation.
Can I turn individual sources off?
No. All sixteen are always on. The Settings panel lists every feed and its weight so you can see exactly what the screener is reading, but the source set itself is fixed — differential weighting does the job that on/off switches would do, more gracefully.
Does it cover all fifty stocks or only a watchlist?
All fifty, always. Scanning, sentiment aggregation and alerting cover the entire index on every pass. The watchlist in the Deep-Dive tab is purely a personal shortlist that stars matching rows in the alert log — it never restricts what gets scanned.
What happens when the index is reconstituted?
The constituent list is fetched live from the exchange at startup, so changes are picked up automatically without a software update. A locally cached list and a bundled fallback list exist only as safety nets for when that request fails.
How does the sentiment scoring actually work?
A rule-based sentiment model handles negation, intensifiers and punctuation correctly, and it is extended with a hand-tuned market vocabulary, because words such as downgrade, buyback, guidance cut and order win either carry no general-English score or carry the wrong one. Each headline's score is then weighted by its source's reliability and decayed by its age on an eight-hour half-life.
Why does a stock's sentiment change when no new headline has arrived?
Because of recency decay. Existing stories continually lose weight as they age, so the source-weighted average drifts even in a quiet window. This is intentional — it stops a strongly worded morning headline from dominating a stock's reading all afternoon.
What are the three signal layers, and which should I use?
Trade Entries is price-confirmed and the most conservative: it requires VWAP, breakout and volume to agree with the news before showing anything. News-Only Setups scores sentiment, headline count and freshness alone and fires sooner but less reliably. News BUY/SELL Signals is a direct threshold on weighted sentiment with no checklist and no levels. Start at the top of that list and work down only when you understand what each layer is giving up.
How are entry, stop-loss and target levels calculated?
On the price-confirmed tab only, and only once the checklist score reaches 65 with a real breakout in progress. Entry is the breakout level itself; the stop is whichever is nearer of VWAP or a tight buffer beneath the breakout; targets sit at 1.5 and 3 times the resulting risk. Every number comes from the live quote and tick history rather than a fixed percentage. On the News-Only tab the bands are deliberately simpler and are labelled as such.
Are the Nifty 50 buy sell signals automatic trade recommendations?
No. They are the output of published rules applied consistently to public news and price data, presented so you can judge them. Nothing in the application constitutes investment advice, and every signal tab carries its own disclaimer about what it does and does not check.
Does it place orders or connect to my broker?
No. There is no broker integration, no order routing and no portfolio module. The application reads public data and displays it. It never touches an account.
Does it cover options or futures?
No. Earlier versions of the tool did carry an options risk helper and a lot-size calculator; both were removed so the news and sentiment engine could be developed properly. There is no option chain, no futures data and no derivatives analysis.
What is the Macro tab for?
For headlines that move the whole market without naming a single stock — policy decisions, inflation data, the Budget, crude, the rupee, institutional flows, ratings actions and global cues. Without a dedicated tab these stories would either be discarded or wrongly attached to a constituent. Use it as context for everything else on screen.
What is a sentiment flip and why does it matter?
It is a stock crossing from bullish to bearish coverage or the reverse, with at least two headlines supporting the new state. It matters because a reversal in tone is more informative than a continuation of it, and because the two-headline requirement means a single outlier cannot trigger one.
Why do I sometimes see one row where three publications ran the same story?
That is cross-source clustering working. Near-identical headlines are normalised and hashed so they collapse into a single row with a source count. This stops one event from inflating a stock's sentiment three times over, and turns corroboration into a useful signal in its own right.
How far back does the history go?
As far back as you have been running the application. Everything is written to a local database and nothing is discarded between sessions, so a trend chart on your seventh day is drawn from seven days of accumulated Nifty 50 stock news. The lookback selector then controls how much of that history feeds the current view, up to seven days.
Where is my data stored, and is any of it uploaded?
In a single history file inside a folder under your Windows user profile; the exact path is shown in Settings. Nothing is uploaded. The only outbound requests the app makes are to the exchange for the constituent list and prices, to the sixteen public RSS feeds, and one licence verification call at activation.
Can I export the data?
Yes. The Export CSV button on the Live News Feed writes everything currently visible, with your filters applied, to a spreadsheet file. Settings also carries an export of all visible news, so a week of categorised, sentiment-scored Nifty 50 stock news moves into your own spreadsheet in one click.
Can I delete everything it has stored?
Yes. Clear local history in Settings permanently wipes all stored news, sentiment snapshots and alerts from the machine, and Clear alert log on the Alerts tab wipes just the alert history.
Is there anything I need to install first?
No. Everything the application needs is contained inside it. There is no installer, no runtime to add and no dependencies to manage — download the file, run it, activate once.
Does it run on Mac or Linux?
Not currently. It is a Windows 10 and Windows 11 application. It may run under a Windows virtual machine or compatibility layer, but that configuration is not tested or supported.
Does it work outside market hours?
Yes. News scanning continues around the clock, because results are published after hours, regulators act in the evening and global cues arrive overnight. The application is aware of the session state — pre-open, open, closed, weekend — and behaves sensibly in each. Live price fields simply hold their last values when the market is shut.
How much internet does it use?
Very little. RSS feeds are small text documents and the exchange requests are lightweight JSON. Even at a fifteen-second refresh the ongoing usage is modest, and any feed that is temporarily unreachable is skipped for that pass without halting the scan.
Will it slow my computer down?
It shouldn't. Scanning and scoring happen in the background, all sixteen feeds are fetched at once rather than in sequence, and the interface stays responsive throughout — the window keeps showing the last known state while a pass is in flight rather than freezing.
Can I run two copies at once?
No. A second window is prevented from opening, which protects your local history from being written to twice at once. Double-clicking the icon a second time simply brings the existing window forward.
How does licensing work?
You enter the email address you purchased with and your licence key once, in an activation dialog that appears before the main window. Verification happens against the payment platform, and the verified result is cached locally so later launches go straight through. The About box shows which email the copy is licensed to and when it was last verified.
Is this a subscription?
No. It is a one-time purchase with no recurring fee, no account and no seat-based billing.
How do I know when there's an update?
Check for Updates in the Help menu opens the product page in your browser, where the current release is listed. The About box shows which release you are running, alongside your licence details.
Why does Windows warn me the first time I run it?
SmartScreen shows a caution for any program it has not yet seen widely distributed, which includes almost all independent software. Choosing More info and then Run anyway proceeds normally. This is a reputation notice, not a detection.
Can I use it for stocks outside the Nifty 50?
No. The universe is deliberately fixed to the index constituents. That constraint is what makes the sector rollup, the market mood score and the heatmap meaningful — they are all computed against a fixed, comparable set of fifty names.
A headline was tagged to the wrong stock. Why?
Symbol tagging matches tickers plus a brand-name map covering common company names. Ambiguity is unavoidable in a headline that mentions several companies or uses an unusual short form, and a single story can legitimately tag more than one constituent. Every row is double-clickable to open the original article, precisely so you can check rather than assume.
What is the honest limitation of the whole approach?
News-based screening is early but noisy; price-based screening is late but precise. Sentiment scoring cannot understand sarcasm, cannot weigh how much of a story is already priced in, and cannot know what a headline omits. That is exactly why the strictest layer in the application refuses to call anything a setup until price action has independently confirmed what the news is saying — and why every layer beneath it is labelled with its own reliability.
Risk disclaimer
This software is an information tool, not investment advice. The Nifty 50 News Screener is not a registered investment adviser, research analyst or broker, and nothing it displays constitutes a recommendation to buy or sell any security.
News sentiment is a probabilistic signal derived from headlines. It is not a price forecast, and no accuracy figure is claimed for it. Signals, scores, entries, stop-losses and targets are the output of published rules applied to public data; they can be and often will be wrong.
Trading and investing in equities carries a risk of loss, including the loss of your entire capital. Past behaviour of any signal, indicator or sentiment reading does not indicate future results. Verify anything important against the original article and your own chart before acting on it, and consider consulting a SEBI-registered investment adviser about your particular circumstances.
Market data and headlines are sourced from third-party feeds and the exchange, and are provided without warranty as to accuracy, completeness or timeliness.